
Wi-Fi Spectrum Analysis, How to Perform One, and What Information It Provides
Table of Contents
How to perform a wifi spectrum analysis is simple.
wifi spectrum analysis is important when analyzing a Wi-Fi infrastructure, it is important to note that, besides 802.11 standard devices.
Many different transmission sources coexist and interfere with the network’s access points, which can have a negative impact on the network’s performance that cannot be explained by analyzing the access point configuration.
We need to perform a Wi-Fi radioelectric spectrum analysis on the Wi-Fi network’s operating frequency strip (802.11) using a site survey tool and a Wi-Spy wifi spectrum analyzer.
To identify these sources so we can determine if they are genuine Wi-Fi transmission (802.11) or rather interference or noise.
Normally, when planning or performing a Wi-Fi infrastructure analysis, also known as passive or active site survey.
The main focus is set on the positioning of the network’s access points, their coverage, the operating channels to avoid overlapping, the operating transmission speeds, and many more parameters and access point configuration and Wi-Fi protocol (802.11) related values.
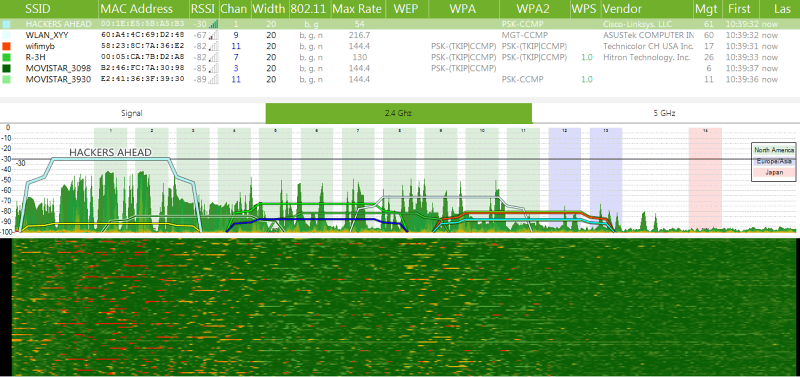
Wi-Fi spectrum real time analysis
The problem lies in focusing all the efforts on the right configuration of the access points in order to optimize their performance.
While obviating the fact that the access points operate “on the air” and the radioelectric medium does not always guarantees a free and available environment, and here is where the Wi-Fi spectrum analysis comes into play.
Why Interference and Noise Affect Wi-Fi (802.11) Networks
Wi-Fi (802.11) transmissions operate in two different frequency ranges, 2.4GHz and 5GHz. The 2.4GHz band was first introduced, and after its success and proliferation, the 5GHz band was included.
The reason for the addition of a new bandwidth is due to the 2.4GHz band is not licensed, in other words, any device manufacturer can use these frequencies and transmit data freely and legally around the world.
This resulted in the emergence of a large number of wireless devices with their own data transmission protocols, that is to say, they do not “speak” Wi-Fi (802.11).
For that reason, we can have a large number of wireless devices sharing our network’s radioelectric medium.
So you can’t see them by using a wifi analyzer or by performing an active or passive site survey, since these methods based on the analysis and monitoring of Wi-Fi (802.11) communications.
How to Perform a Professional Site Survey
If we need to perform a professional site survey, besides the active and passive site surveys, we need to perform a radioelectric spectrum site survey (Wi-Fi spectrum analysis)
This , apart from wireless network and device parameters, it provides us with readings of all other radioelectric transmission sources that coexists with Wi-Fi (802.11) transmissions that generate interference or noise, which degrade the performance of the wireless communications.
Interfering Devices (CCTV, iBeacon)
The most common devices that create interference and noise in a wireless infrastructure are:
- Microwave ovens.
- CCTV wireless surveillance video cameras.
- Wireless baby monitors.
- Bluetooth devices.
- iBeacons.
- Some car alarms.
- Wireless phones.
- Wireless microphones
- ZigBee (802.15.4).
- Wi-Fi jammers.
You can probably identify at least two of these wave transmitters operating in the Wi-Fi (802.11) range within your wireless infrastructure.
How to Detect Noise Sources.
In order to perform a Wi-Fi spectrum analysis, we need a special hardware that is specifically design for professional use.
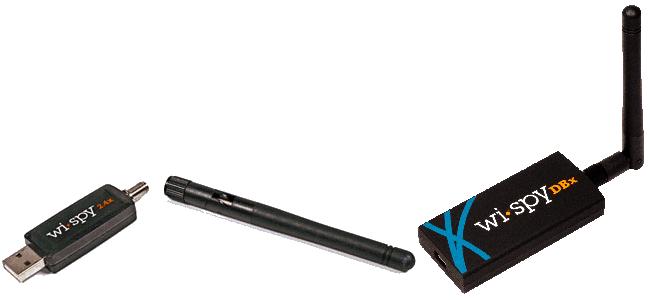
Wi-Spy spectrum analyzer
We will use the following models of Wi-Spy spectrum analyzers:
- 2.4x (2.4 GHz)
- DBx (2.4 y 5GHz)
The Wi-Spy spectrum analyzers do not require drivers, and when plugged into a USB port, they can be configured according to the frequency band to be analyzed.
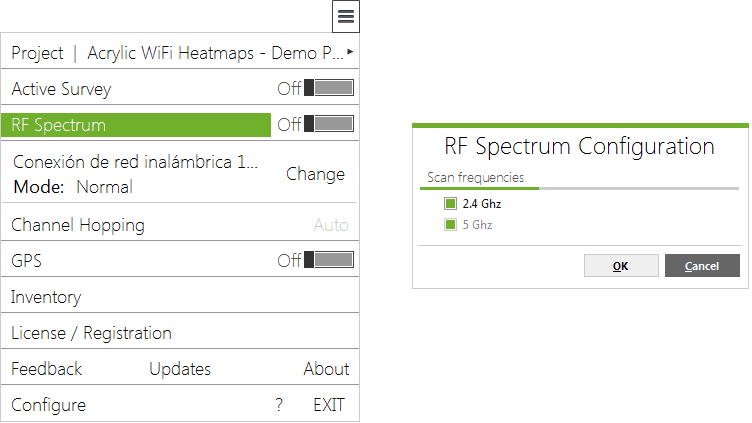
Wi-Fi spectrum analyzer frequency configuration
Once the spectrum analyzer is configured, we can start the wifi spectrum analysis.
either over a building blueprint or satellite imagery, by performing single length measurements, continuous mode capturing that would save us some time, or GPS positioning for outdoor areas.
Once the Wi-Fi spectrum analysis is complete, we will have a resulting graphic or plot of the RF spectrum that we can use to generate a radioelectric heatmap.
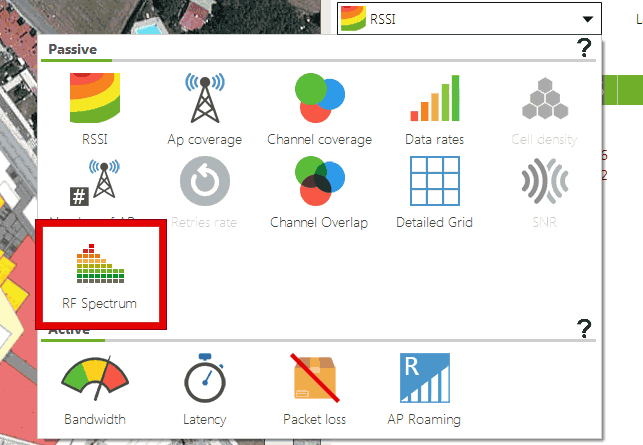
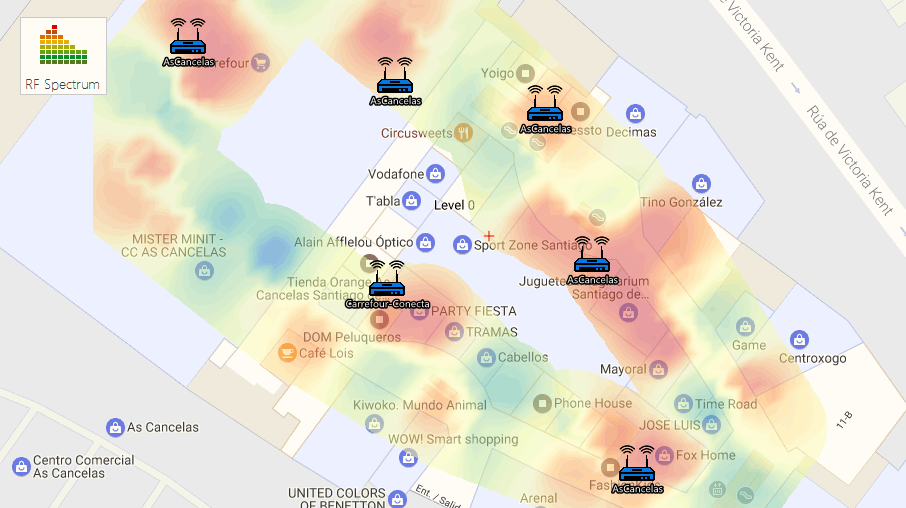
Generating Wi-Fi spectrum heatmap
Unlike a conventional signal strength heatmap, this heatmap does not only display the signal strength values for our network’s access points.
Also for any other devices operating on the same Wi-Fi (802.11) frequency range, from a microwave oven to a CCTV surveillance camera, wireless phone, or bluetooth device.
How to Read a wifi spectrum analysis.
If we compare a RSSI heatmap with a Wi-Fi spectrum heatmap, we will be able to quickly identify those transmission sources that are not access points within our network coverage area.
Likewise, since we know the locations of our network’s access points, we can overlap the access point locations on the Wi-Fi spectrum analysis heatmap.
So to identify transmission sources other than our access points that may be creating interference or noise.
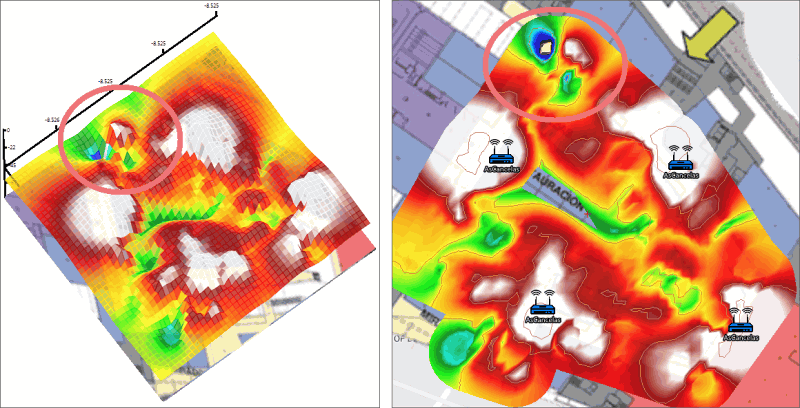
Detecting interferences on a Wi-Fi spectrum heatmap
With this valuable information, we will be able to proceed to identify all those transmitting devices that are interfering within our radioelectric medium.
disable wireless transmission on those devices we have control over, and reposition or replacing those that may be negatively impacting the quality of the Wi-Fi communications.
As we can see, identifying noise sources or interfering devices in our radioelectric spectrum through a Wi-Fi spectrum analysis is quick and easy, providing a great improvement to out Wi-Fi communications.
This prevents interference and noise in your signal, reduces data packet forwarding, improves signal quality and access point coverage, and overall network speed and performance by helping eliminate transmission sources sharing the radioelectric medium.
Download Acrylic Wi-Fi Heatmaps to analyze your Wi-Fi network spectrum
This article is part of a series of articles about how to run a professional wifi site survey
- How to create a Wi-Fi coverage report (site survey report)
- How to perform a Wi-Fi monitoring for a site survey
- Active Wi-Fi site survey using Iperf, real time wireless measurements
- Wi-Fi network quality: how to measure it?
- Wi-Fi Spectrum Analysis, How to Perform One, and What Information It Provides
- wifi planning, Design and locate access points in a simulation.