
How to perform a Wi-Fi monitoring for a site survey
Table of Contents
Once we have created our project and added blueprints for our measurements, we then continue with a Wi-Fi monitoring through a Wi-Fi site survey data capture.
Acrylic Wi-Fi Heatmaps allows you to perform a Wi-Fi network traffic monitoring using any wireless card. Traffic monitoring is about capturing and analyzing the Wi-Fi frames that are detected by the computer running Acrylic Wi-Fi, to then display the frame extracted information on the networks and devices involved in the communication.
Selecting Wi-Fi monitoring mode
There are three data capture modes that can be executed from the software:
- Normal Mode: A wireless card normally operated on this mode. On this mode, a wireless card captures the information on the Wi-Fi networks within reach, and it allows you to detect access point beacon messages, as well as devices operating on ad-hoc mode.
- 100% functional with any wireless card
- On this mode, you will not be able to survey the following values:
- Device Density.
- Packet Loss.
- Monitor Mode: In this mode, the wireless card can capture all the Wi-Fi traffic within reach, so a PC equipped with a wireless card working on Monitor mode is able to detect which devices are sending or receiving Wi-Fi frames within the wireless card’s coverage area, and capture those packets to later analyze them. The Monitor mode provides detailed information about 802.11 standard compliant devices and networks in the wireless card range.
- Compatible wireless cards are required for this mode to properly work .
- Signal quality or Signal to Noise Rate (SNR) is not provided on this mode.
- AirPcap Mode: This mode should be selected when capturing data using an AirPcap wireless card.
- An AirPcap wireless card is required.
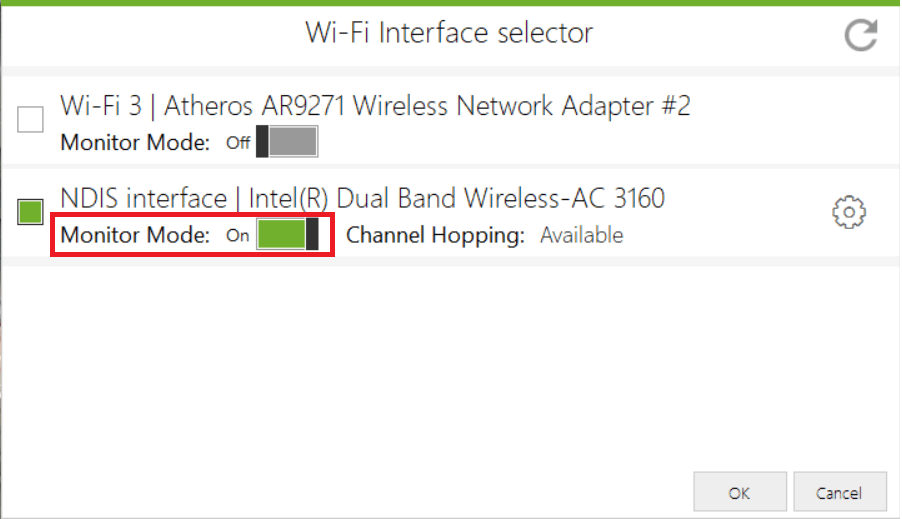
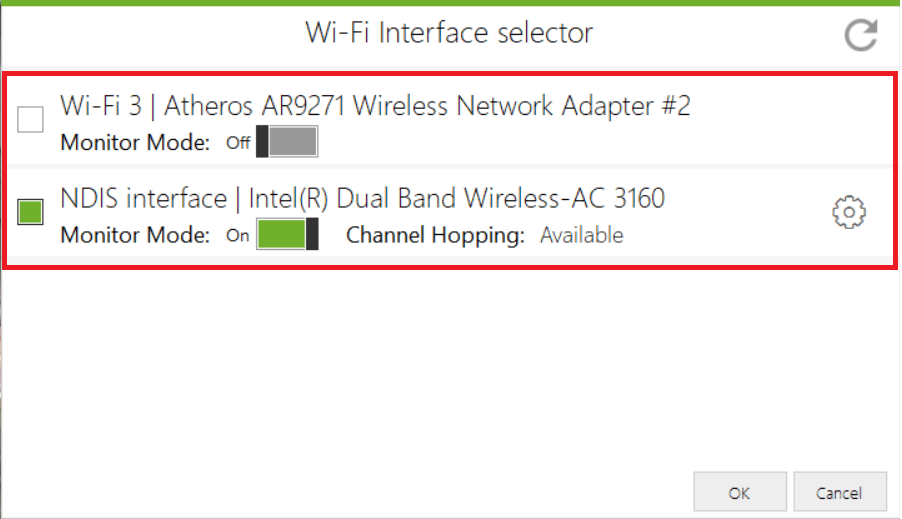
Interface Selection for Wi-Fi Monitoring
Acrylic Wi-Fi Heatmaps allows you to select a Wi-Fi interface, from the ones available in the computer, that will be used for the monitoring. Clicking on the scroll down menu on the upper right area of the application window displays a list of available interfaces to choose from for the monitoring.
Selecting the Monitoring Location:
Projects created on Acrylic Wi-Fi are sorted by Locations. When a monitoring is performed, Scans are added to the selected location. The scroll down menu at the top of the application window allows us to choose one of the project’s previously defined locations, on which the monitoring will be performed. 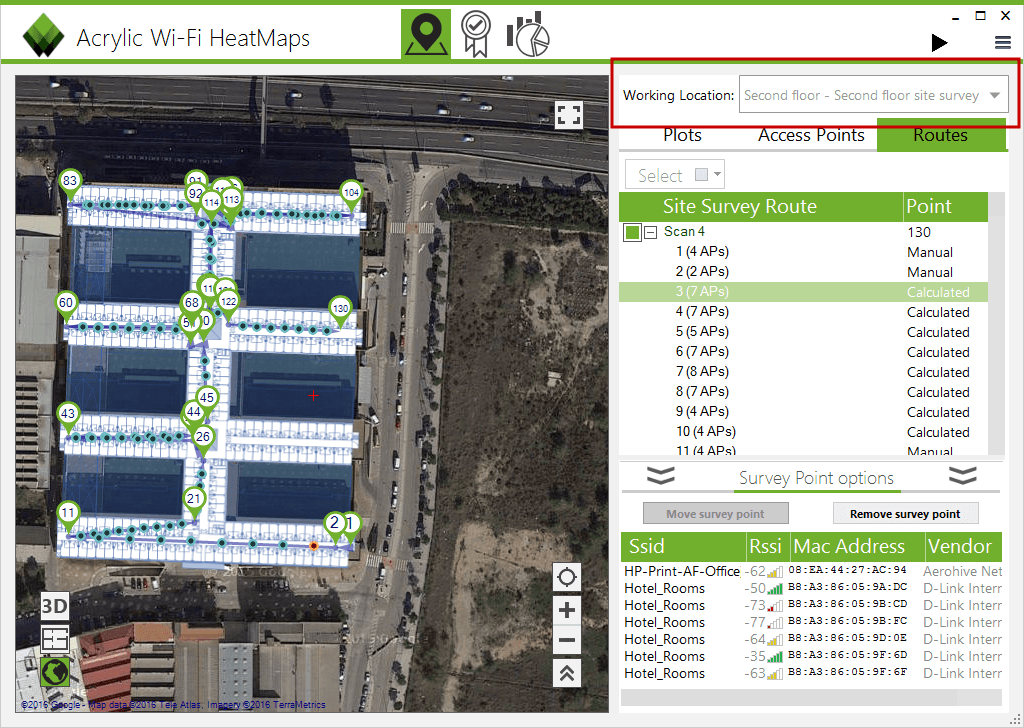
Starting a Wi-Fi Monitoring
To start monitoring on Acrylic Wi-Fi Heatmaps, once all the previous steps have been configured, press the Start button at the upper right area of the software interface. 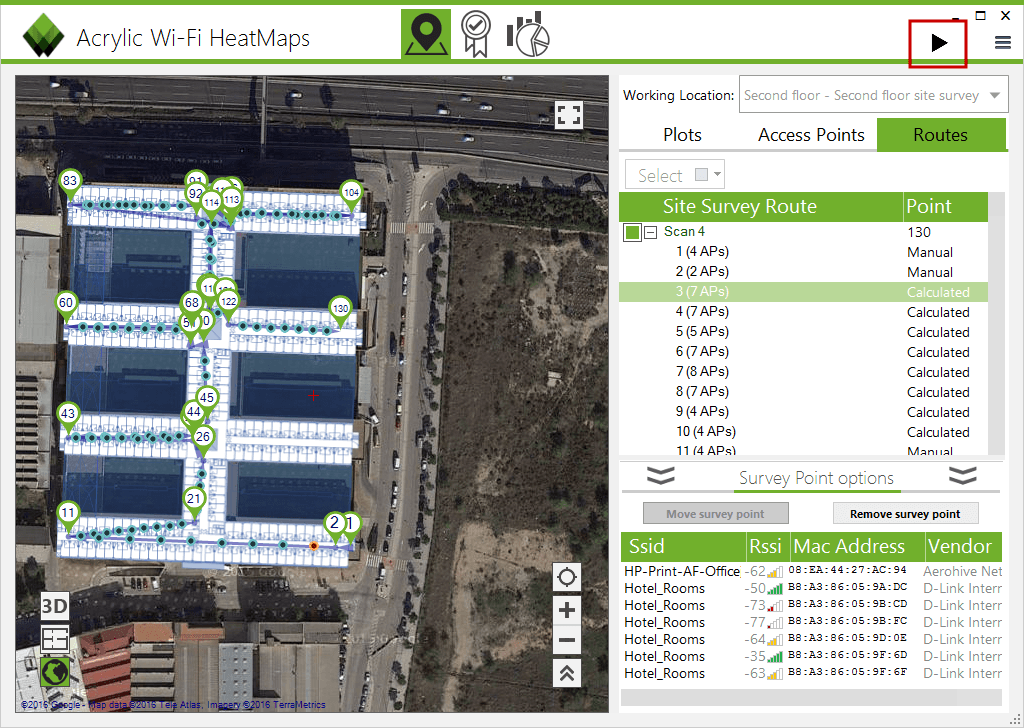
Performing Wi-Fi Measurements
Acrylic Wi-Fi Heatmaps detects the Wi-Fi devices that are transmitting within the reach of the selected wireless network card. During the monitoring, the collected information on the access points within reach will be stored in the project for later analysis. In order to perform these measurements, follow the steps below:
- Go to section “Survey” on the left panel menu.
- Select Blueprint mode or Satellite mode.
- At the upper left area, you can pause or stop the monitoring, and choose the monitoring measurement mode.
- The Scan in progress shows the Survey Points that will be created during the monitoring.
Data capture can be performed while visualizing the information on two different panels: Blueprint Mode: Monitoring is performed on the previously uploaded location “Blueprint”. 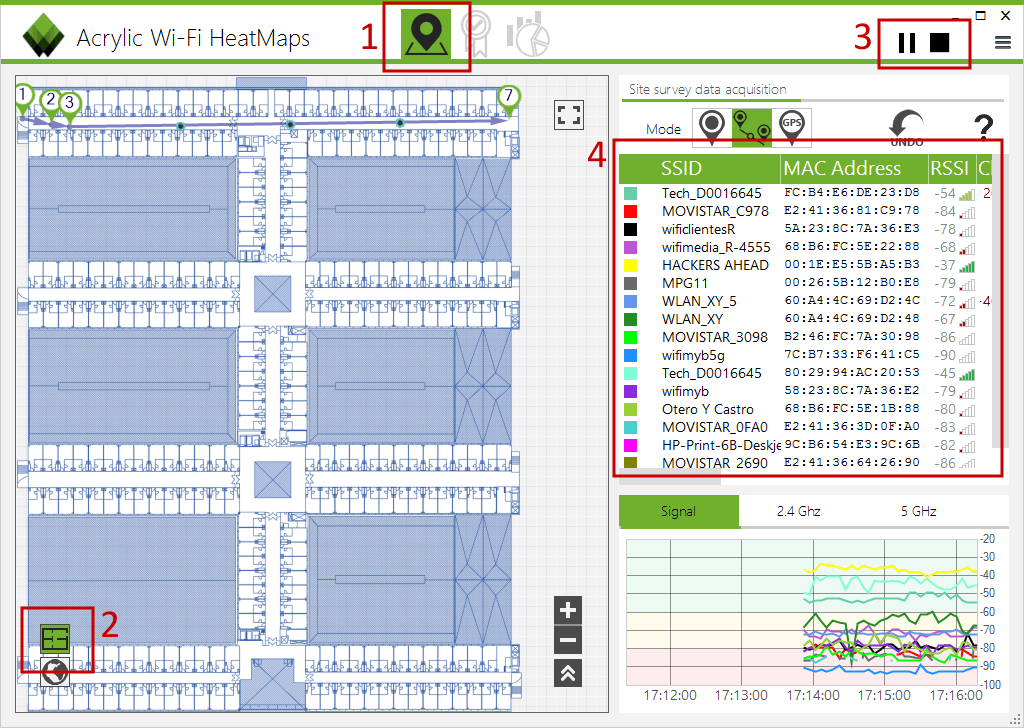 Satellite Mode: Monitoring is performed using an online satellite map service. In case the project has a location blueprint uploaded, it will be overlapped.
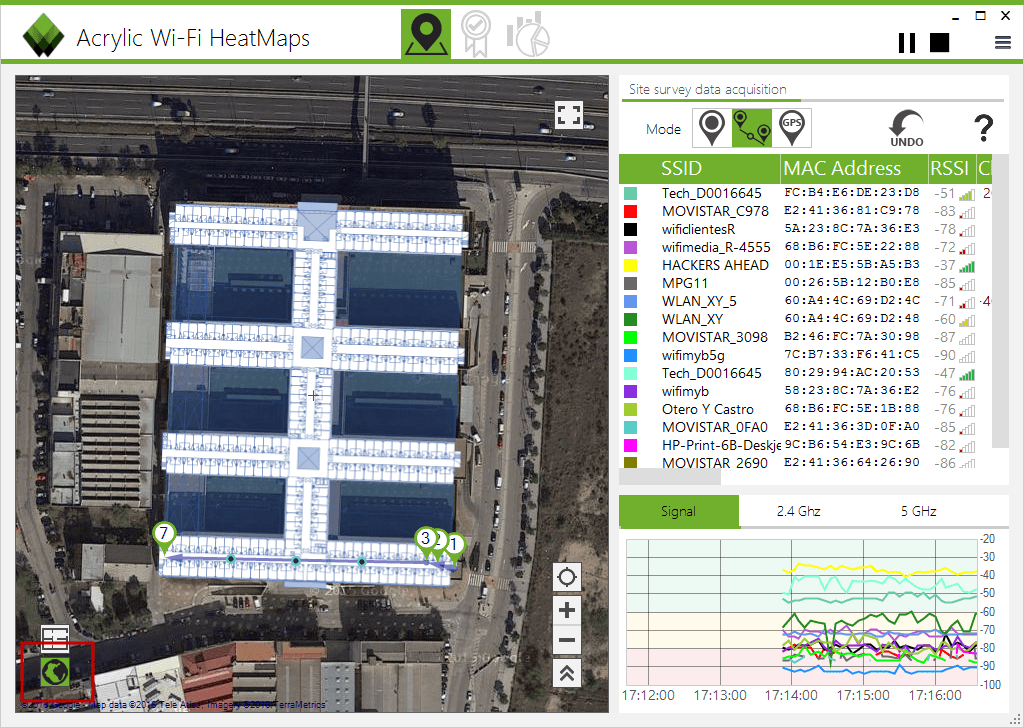
Manual Wi-Fi Measurement
This is the default measurement type, and it is recommended for specific or small area measurements On this mode, the user only needs to click on the map instead of physically being at the measurement location. Acrylic Wi-Fi will add a point for each click on the map and will show all detected access points. The application will assign each point successive numbers, as they are marked, and it will connect all these points with a line to display the path followed from point to point 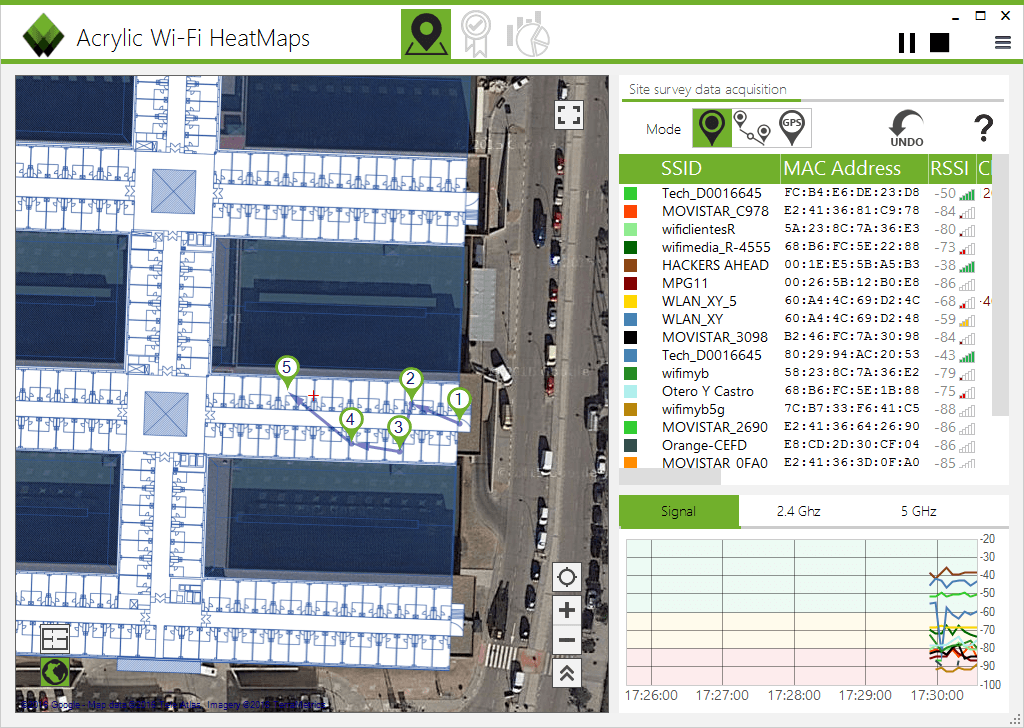
Continuous Wi-Fi Measurement
This measurement type is recommended for large indoor or outdoor areas when a GPS device is not available or GPS accuracy is insufficient. To enable continuous measurement, after starting the monitoring, you have to click on the walking man icon next to the Start button, then click on the location where the user is positioned, and the user will start walking maintaining a straight course at a constant pace until a change in direction is made to then click again to indicate the new user position, and the user will continue walking until the next change in direction, repeating the procedure until the end of the path. Acrylic Wi-Fi Heatmaps will perform the measurements along the path, optimizing time and efforts when covering large areas, and reducing the time required to measure all the networks within the surveyed area. 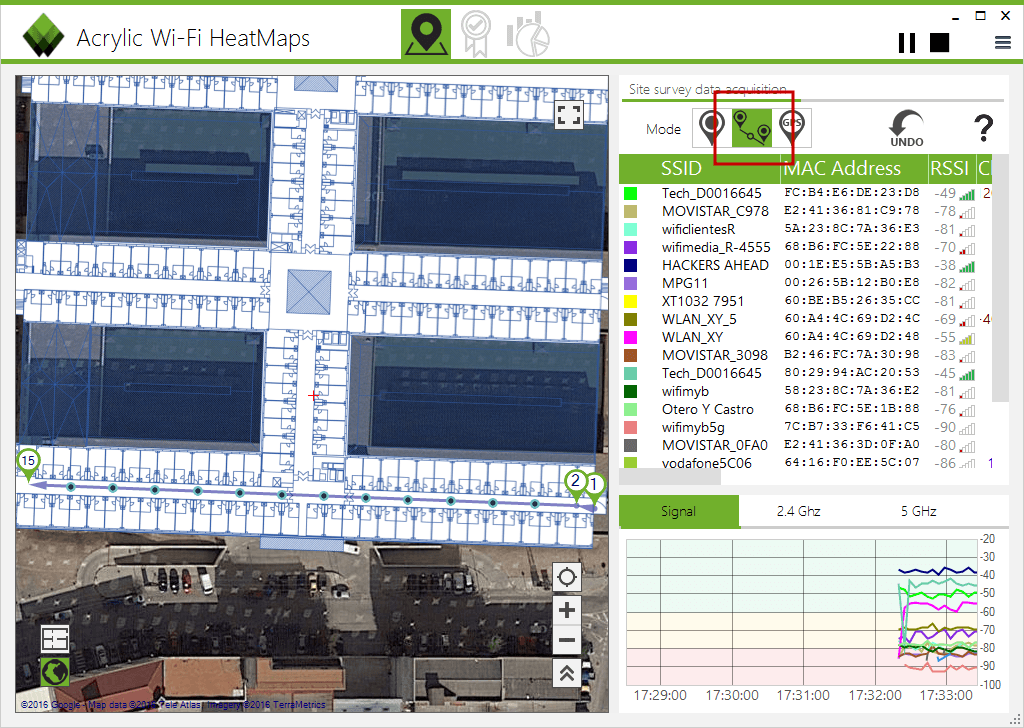
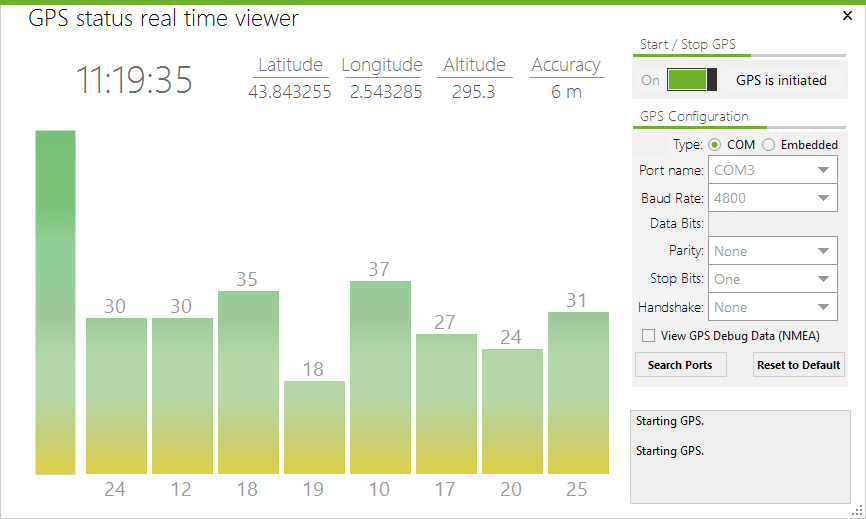
Real-Time Measurement (GPS)
This measurement type is recommended for outdoor and large areas. A connected and configured GPS device is required. During the monitoring with an activated GPS device, a new measurement point will be automatically generated for each GPS coordinate obtained. This mode operates automatically, and once the monitoring starts, Acrylic Wi-Fi Heatmaps will GPS position and georeference all network measurements. 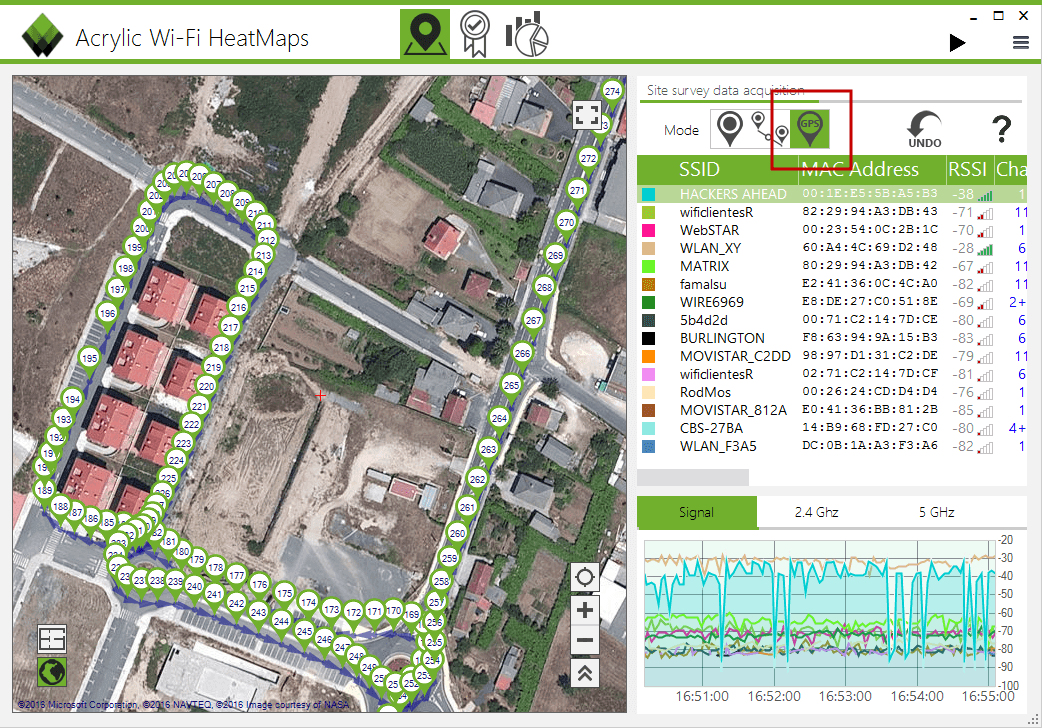
- Click on the GPS button at the upper right area.
- Select a port to connect the GPS device
- Modify, if necessary, the GPS configuration values.
- Monitoring can begin once the GPS device has good coverage.
- Click on the Start button to start. Click on the Stop button to stop.
Visualizing Wi-Fi Monitoring Data
Acrylic Wi-Fi Heatmaps allows you to quickly and easily visualize all the data obtained during the site survey. For the location selected from the top scroll down menu, under the “Routes” tab, you will see a list of the “Scans” performed during the survey at this location, and you will be able to visualize each scan’s path and measurement points. Acrylic Wi-Fi Heatmaps automatically locates the approximate position of the discovered access points, so you will also see the access point locations represented on the map. 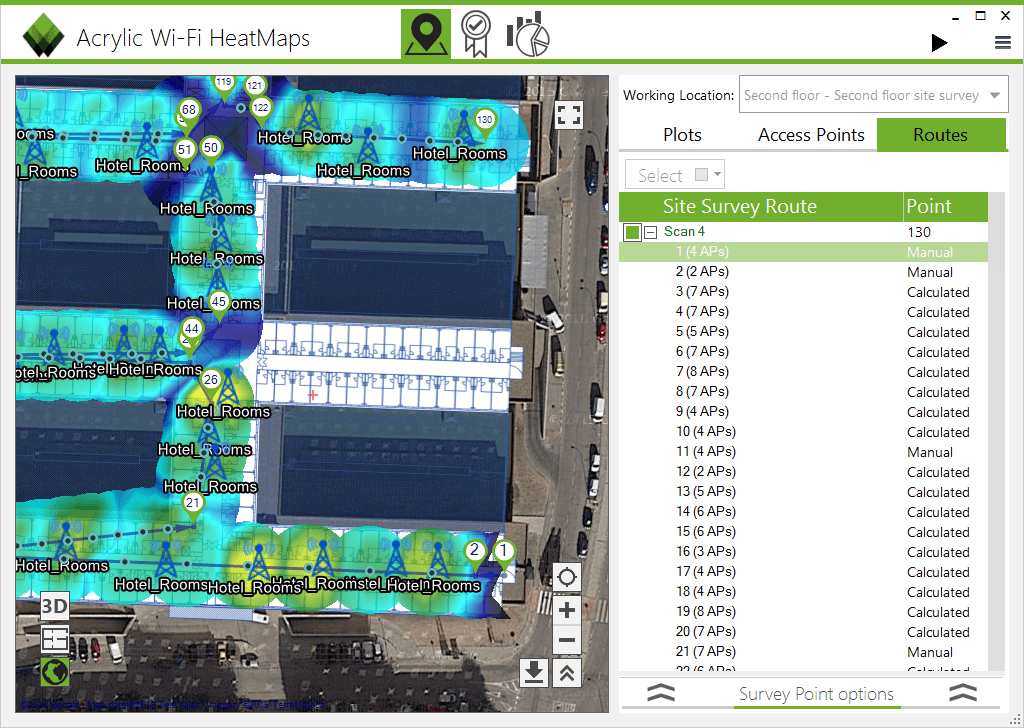 For each measurement point, a list of visible access points with their signal strength levels is displayed for the current location. You can access measurement data as follows:
- Performed measurements are shown on the map:
 : Points where a measurement was performed.
 : Points generated on Continuous Mode.
 : Point selected on the right side menu.
- Access Points: Shows the positions of all points detected during the monitoring. You can manually indicate an access point location using the “Manual Locate” button.
- Survey Points: Monitoring measurement points. Measurement points can be moved or deleted.
- Visible Networks: Clicking on a measurement point displays the information on the Wi-Fi networks detected at that point.
With all the information collected during the Wi-Fi site survey software, the next step will be generating Wi-Fi coverage and heat maps from which you can obtain important information to improve your wireless network, making the most of the performed Wi-Fi monitoring.
This article is part of a series of articles about how to run a professional wifi site survey
- How to create a Wi-Fi coverage report (site survey report)
- How to perform a Wi-Fi monitoring for a site survey
- Active Wi-Fi site survey using Iperf, real time wireless measurements
- Wi-Fi network quality: how to measure it?
- Wi-Fi Spectrum Analysis, How to Perform One, and What Information It Provides
- wifi planning, Design and locate access points in a simulation.