
How to create a Wi-Fi coverage report (site survey report)
When using a Wi-Fi coverage analysis (site survey) software, the last step consists of generating a Wi-Fi coverage report including the results obtained during the analysis, and embedding the rendered Wi-Fi coverage maps on the generated documents.
In our previous tutorials, we have learned how to create a Wi-Fi site survey project using Acrylic Wi-Fi Heatmaps and how to calibrate a map for a site survey analysis. In this tutorial, we will learn how to generate a Wi-Fi heatmap or coverage map.
In order to generate a Wi-Fi report on Acrylic Wi-Fi HeatMaps, a number of requirements should be met:
- Project: Having a site survey project created with at least one location.
- Measurements: There should be at least one measurement associated with the locations. Measurements are geolocalized Wi-Fi traffic captures that are taken using the “Online maps” (satellite) or “Plans” (blueprints) functions from the Survey section.
Wi-Fi Coverage and Heatmap Report Configurations
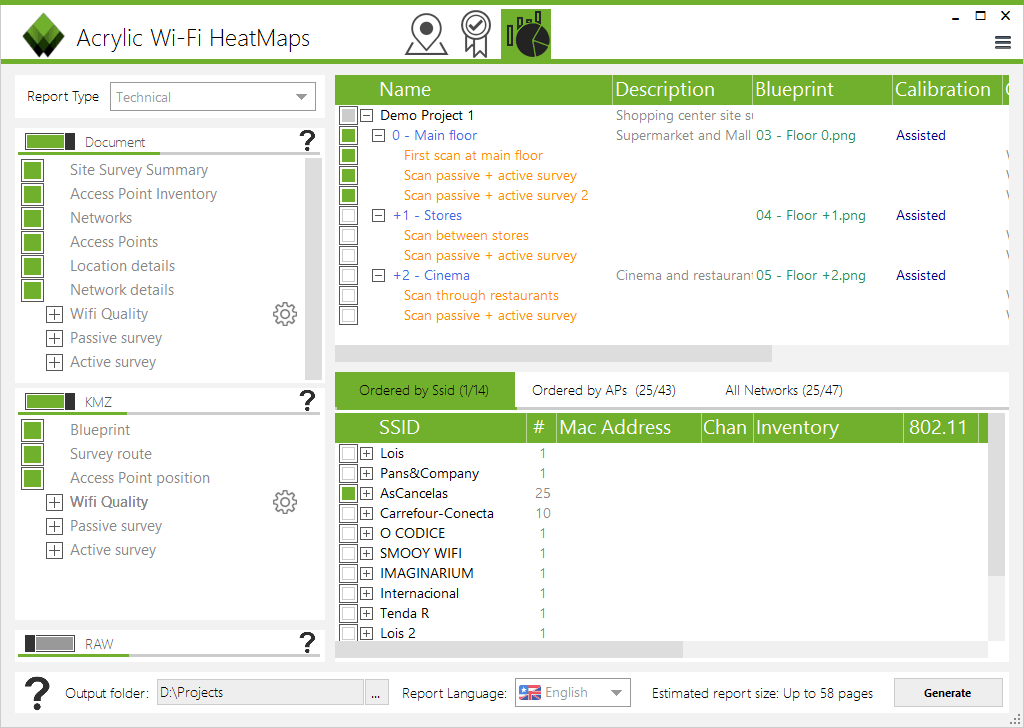
The Wi-Fi coverage report parameters that can be configured from the “Reports” menu are:
- Locations to be included in the report from the project’s locations
- Scans associated with each locations.
- Access points (BSSID) or Wi-Fi networks (SSID) to be included in the report.
- Company logo that will be displayed on the Wi-Fi report cover.
- Report sections with different Wi-Fi map types and their attributes.
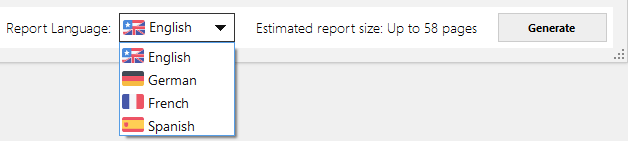
- Wi-Fi coverage report language (Spanish, English, German, or French)
 A report can be generated in two different formats: as a Microsoft Word document, or as a KMZ file, for viewing on Google Earth.
The selection of the access points to be included in the report can be done from three different tabs:
- Sorted by SSID: AP’s are displayed by Wi-Fi network name.
- Sorted by AP: AP’s are displayed by physical AP’s.
- All networks: Complete list of AP’s.
In the sorted by physical AP view, you will see a list of AP’s where the last digit of their respective MAC addresses (BSSID) is hidden. A physical access point could, for example, create 8 different virtual access points, propagating 4 networks on 2.4Ghz and these same networks on 5Ghz.
Maps Included in a Coverage Report
The scroll-down selector on the “Report generator” section displays all maps supported by Acrylic Wi-Fi Heatmaps and the report sections, in which you can find an inventory of discovered networks, routes followed in the site survey, measurement points inventory, etc. 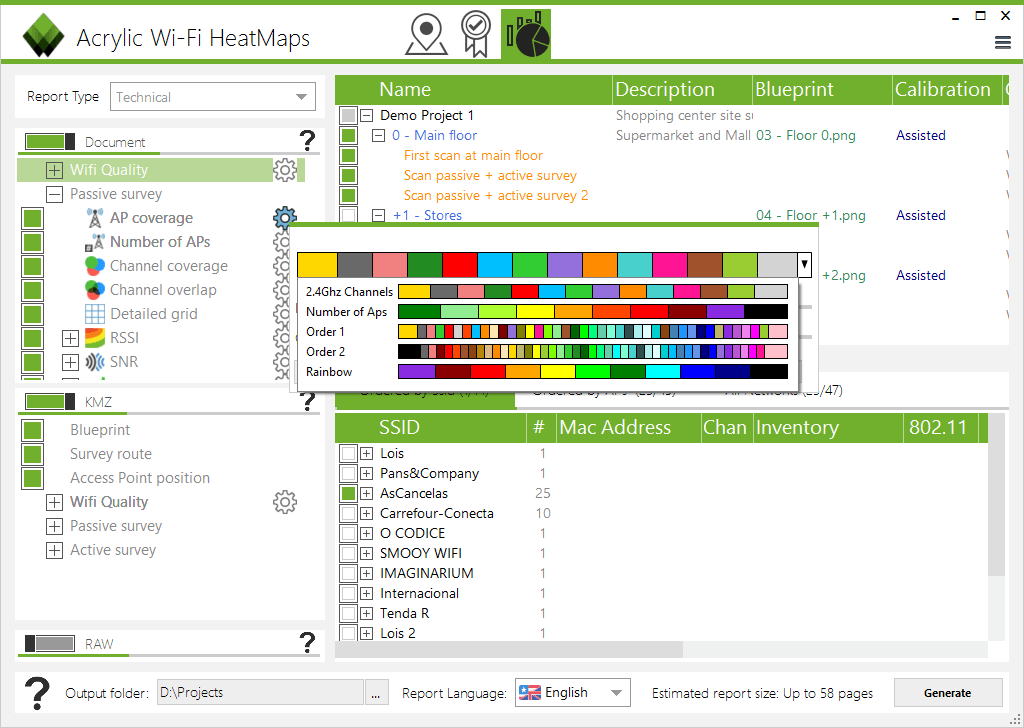 The Wi-Fi site survey report section configuration is very flexible and it has its own attributes such as color scheme or signal ranges.
 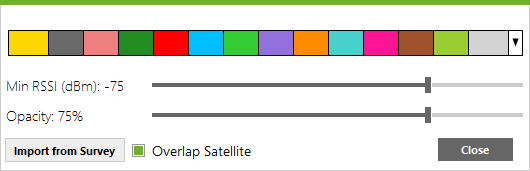 These color schemes are different for each type of map.
 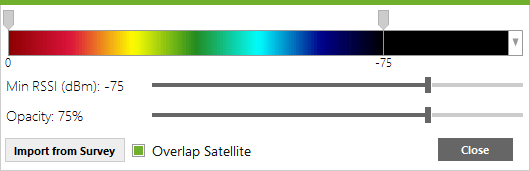 After selecting all the options of your choice, clicking on the “Generate” button will start the Wi-Fi coverage report generation process. For each selected access point, many different coverage maps are to be rendered.
 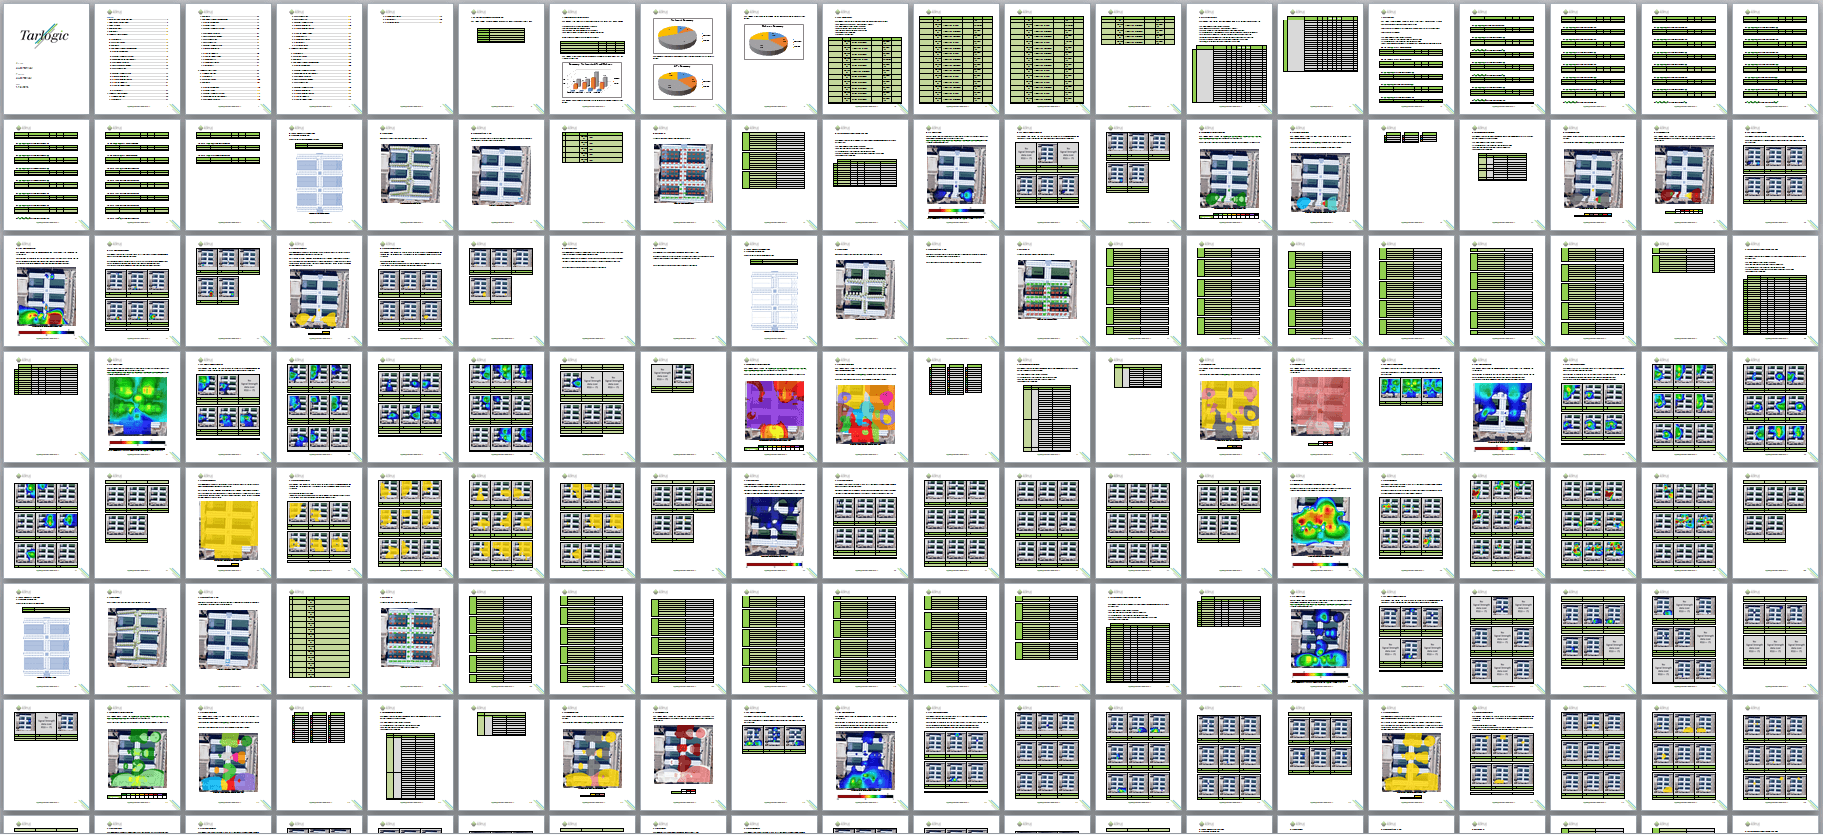 From Google Earth, you will also be able to visualize the generated results for each Wi-Fi access point.
 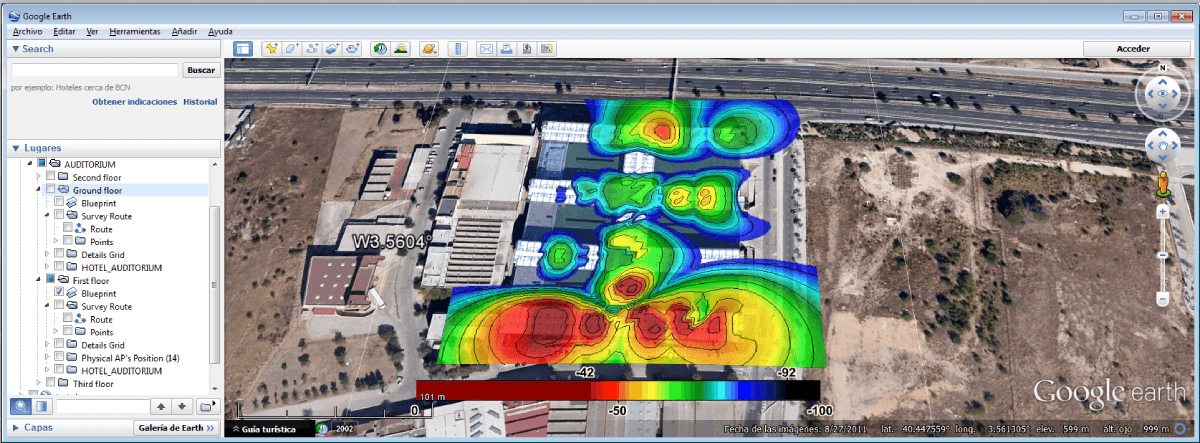 You can refer to and download sample Wi-Fi coverage reports generated by Acrylic Wi-Fi Heatmaps in real environments.
You may also be interested in the following site survey software tutorials for Acrylic Wi-Fi Heatmaps:
- How to Create a Wi-Fi Site Survey Project
- How to Calibrate a Map for Site Survey Analysis
- How to Create a Wi-Fi Heatmap
- Wi-Fi Coverage Report (Site Survey)
- 3D Coverage Maps
This article is part of a series of articles about how to run a professional wifi site survey
- How to create a Wi-Fi coverage report (site survey report)
- How to perform a Wi-Fi monitoring for a site survey
- Active Wi-Fi site survey using Iperf, real time wireless measurements
- Wi-Fi network quality: how to measure it?
- Wi-Fi Spectrum Analysis, How to Perform One, and What Information It Provides
- wifi planning, Design and locate access points in a simulation.