
How to check the WiFi signal strength
Table of Contents

A good WiFi signal strength is critical to enjoying a rewarding online experience without connection failures that spoil the party. Therefore, it is essential to know its status in detail so that, if there is any problem, we have the right tools to solve it
Computers, televisions, cell phones, consoles, even refrigerators and vacuum cleaners—the number of devices connected to our network is immense nowadays, translating into the need for an internet service powerful enough to support high bandwidth demand.
Even so, no matter how many megabytes we contract, these may be insufficient, thanks to the low efficiency of our Wi-Fi network, which can be the bottleneck. So, it is crucial to know its status and health at all times. The connection speed, the level of congestion, the presence of interference or the signal strength are factors to consider when determining whether our network works at 100%.
In today’s article, we delve into the crucial topic of understanding the importance of having an adequate wifi signal strength and how to check its status.
What methods can be used to check the strength of the WiFi signal on any device?
There are several straightforward methods to check the proper functioning of our WiFi network, ensuring that it is not being wasted. Among the most effective are the following:
- Devices’ own interface. All devices that can be connected to WiFi have a graph or indicator of the signal strength of the WiFi to which they are connected.
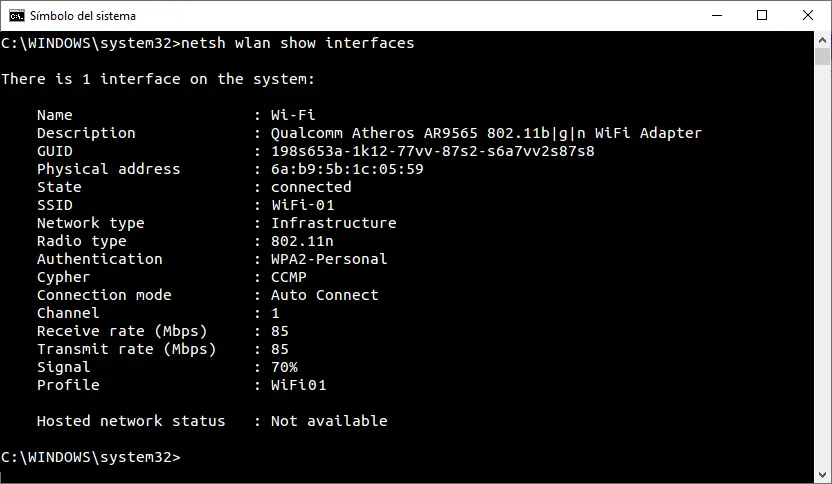
- Integrated software. For example, we can see the strength of the WiFi signal reaching our computer using system software such as Windows Powershell or cmd. This will perform a basic analysis, showing data such as the upload and download speed and the power or signal strength represented as a percentage. To do this, use the command “netsh wlan show interfaces.”
- Acrylic WiFi Analyzer. This is the most complete option and provides the most information. Moreover, it is free of charge. Using our WiFi scanning application allows you to obtain the required information in a matter of seconds, presented intuitively. In addition to measuring the WiFi signal strength, the Acrylic WiFi Analyzer identifies and checks the network’s health, displaying data on channel congestion, download speed, signal/noise ratio, and security level.
What factors affect WiFi signal strength?
Several factors can reduce the strength of our router’s WiFi signal. Some can be easily solved, but others are more complicated to solve. Here are some of them:
- Location of the router. Where and how we place our router is decisive when it comes to efficiently using our network. Placing it in a clear and elevated place is a practice that allows us to have an excellent starting point to maximize the intensity of the WiFi signal.
- Distance to the router. The farther away, the lower the strength and the worse the connection. It is a simple rule. This is due to the scattering and attenuation of radio waves with distance. Even so, the distance to the device affects differently depending on the band we use. For example, the 2.4 GHz band has greater coverage, while the 5 GHz and 6 GHz (WiFi 6E) bands are more limited, and the area they can cover is smaller. A wise decision is to use several simultaneously, connecting the closest devices to the 5GHz or 6 GHz bands and the farthest ones to the 2.4 GHz band.
- Walls, floors and ceilings. The wiring and metal structures inside these elements substantially decrease the WiFi signal strength. This is because a Faraday cage is created, blocking the electromagnetic waves emitted by the router.
- Electronic devices. Several devices and appliances, such as microwaves, work on the same frequencies as our network. This can cause interference that can negatively impact the strength of the WiFi signal.
- Other WiFi networks. The congestion of communication channels caused by the coexistence of several networks is directly related to their performance. Fortunately, several channels are available for each band (2.4 GHz, 5 GHz and 6 GHz), so it is plausible to use an uncongested channel and thus improve the WiFi signal strength.
What is a WiFi map and how is made?
But how can we quantitatively measure the loss of WiFi signal strength?
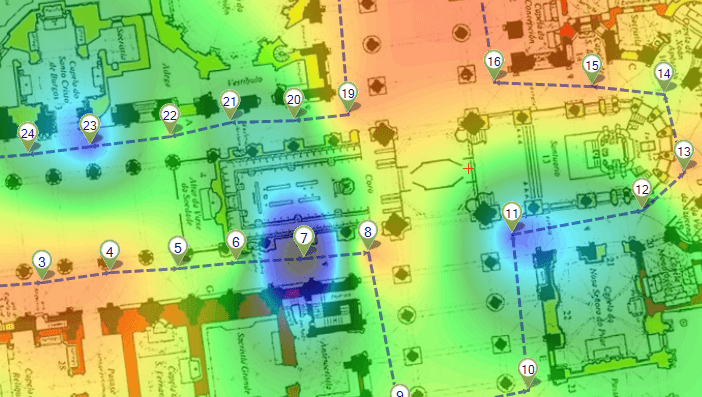
One option is to create a WiFi map or heatmap. Thanks to this tool, we will know exactly which points of our home have the best coverage and which suffer from a poor connection.
The easiest way to create a WiFi map is to use a WiFi planning application that allows us to create a custom heatmap. Acrylic provides a fast and accessible experience with our WiFi Heatmaps software.
Using the information these maps provide, we can make decisions to improve the WiFi signal strength, such as repositioning the router or using repeaters.
How to understand the data obtained
Such specialized tools express the RSSI (Received Signal Strength Indicator) signal strength in dBm, using a scale from 0 to -100. The closer the number is to -100 dBm, the worse the WiFi signal strength will be, and vice versa.
Under normal conditions, we can consider the signal strength to be:
- Excellent (-30 to -50 dBm): This signal is extremely strong. With this strength, we can expect maximum connection speeds and optimal performance for all applications, including HD video streaming and online gaming.
- Very good (-51 to -60 dBm): This provides a high-quality connection with fast internet speeds, ideal for most online activities, including video conferencing and media streaming.
- Good (-61 to -70 dBm): This signal is adequate for most Internet tasks, although it may not be sufficient for high bandwidth or low latency applications, such as some online games. It is usually the most common strength when using WiFi.
- Poor (-71 to -80 dBm): With this signal strength, you will likely experience reduced connection speeds and possible dropouts. Web browsing and email may work, but media streaming and online gaming may experience problems.
- Poor or unstable (-81 dBm or worse): The connection is likely unstable or nonexistent. Disconnections are common, and performing even the most basic tasks online can be challenging.
On devices such as computers or cell phones, the strength of the WiFi signal, often represented by bars, does not have a direct and standardized equivalence in terms of dBm. Still, we can establish some representative equivalences:
For a 3-bar WiFi graph:
- Three bars: Very good signal, approximately -50 dBm to -60 dBm.
- Two bars: Good signal, generally from -60 dBm to -70 dBm.
- One bar: Weak signal, probably in the range of -70 dBm to -80 dBm or lower.
For a 4-bar WiFi graph:
- Four bars: Excellent signal, in the range of -50 dBm or better.
- Three bars: Very good signal, approximately -60 dBm to -70 dBm.
- Two bars: Moderate signal, generally -70 dBm to -80 dBm.
- One bar: Weak signal, in the range of -80 dBm or worse.
What other measures can be taken to enhance the intensity?
After checking the WiFi signal strength and solving any coverage and connection problems, it is crucial to analyze what types of devices connect to our network and whether they use older versions of the WiFi protocol.
In general, routers and access points are configured to be as flexible as possible, i.e. any device can be connected regardless of whether it is new or old. If we connect a new and an old WiFi device simultaneously, the WiFi network will operate in “old mode”, using an outdated and less fast WiFi protocol.
The ideal in these cases is to analyze the devices we have connected and see if we can connect the older ones to the 2.4 GHz band and the newer ones to the 5 GHz or 6 GHz band. In the worst case, we could install a specific access point for the slower devices and leave the router for the faster ones, simply playing with the names of the SSIDs to differentiate the different networks.