
Wifi site survey project, How to create. Video tutorial included
Table of Contents
wifi site survey, how to verify a wireless network
This Acrylic WiFi Heatmaps video tutorial explains how to quickly and easily perform a wifi site survey.
An analysis that allows you to check the performance of a wireless infrastructure: measure WiFi network coverage, generate heatmaps of Wi-Fi coverage and determine how to improve the network’s performance.
In this video tutorial you will learn step by step how to create a new wifi site survey project, how to capture data, analyze it and how to create an editable report.
1. Creating a new project
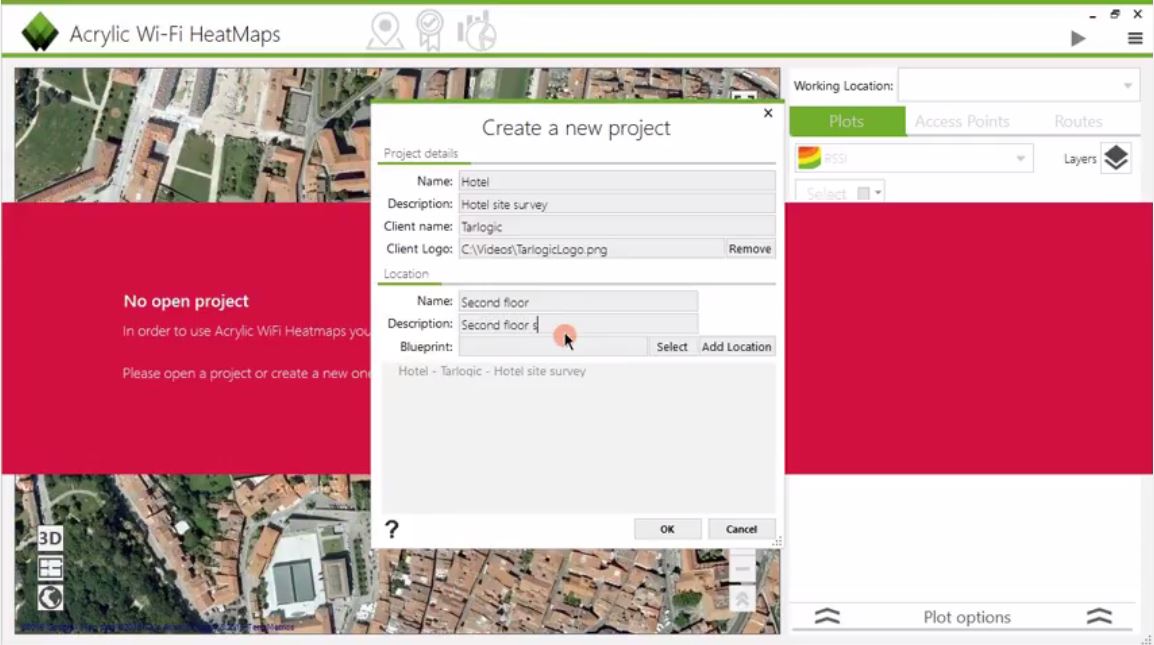
First of all, you will see how to create a new wifi site survey project.
You must define the project essential information (which you can edit later) as well as the locations, which are the different areas in which a project is divided.
For example, the floors in a building or the faculty buildings on a University campus.
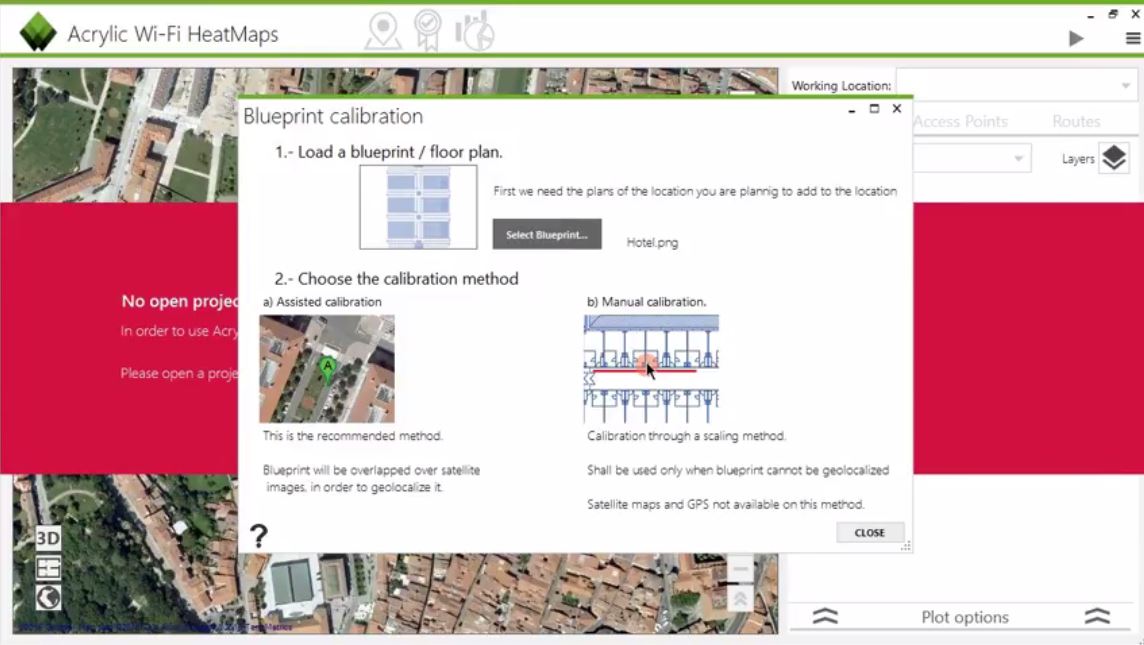
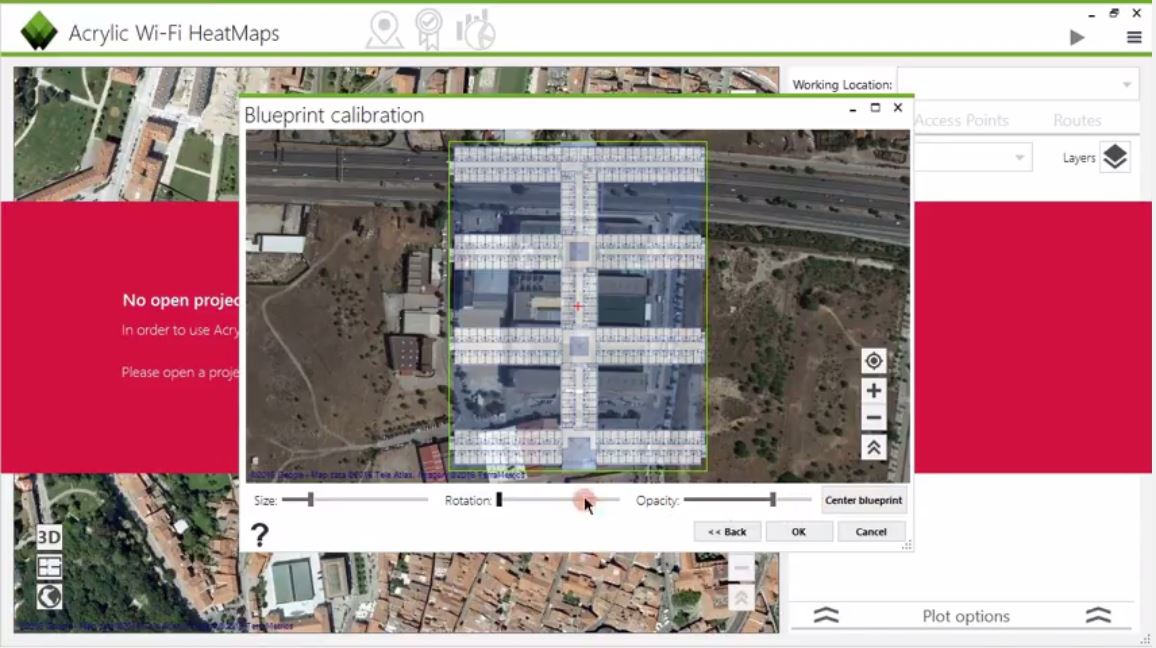
You can use a blueprint or map in order to place measurement points. After adding a blueprint is necessary to calibrate it.
You can do this manually, by indicating a known distance between two points, or intuitively, by using a GIS provider service, such as Google Maps.
2. Performing the site survey
To start the data capture process, go to the Site Survey screen and click on the “Play” button at the right top.
This will open a dialog to enter to enter the name of the scan that you are about to perform. For each location, you can perform as many scans as you want.
To begin the data capture process, select your current position in the map.
For large surveyed areas, it is recommended to select the Continuous Capture Mode, where you are only required to enter your position at the beginning of the survey and the point in which you change direction.
Walking straight at a constant pace until you reach a corner, where you need to indicate your position once more.
During the scan, Acrylic Wi-Fi automatically performs the measurements along the way.
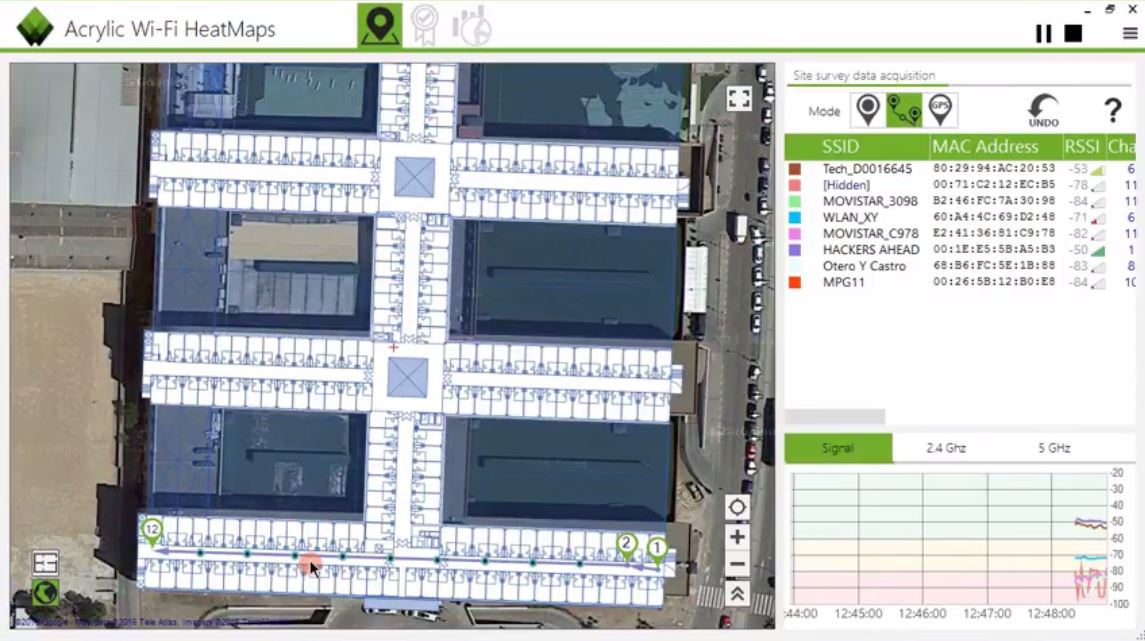
During the data capturing you can visualize, at the right side of the screen, all the collected information in real time for all detected networks.
As well as the details of all the access points in operation within the surveyed area, such as maximum transfer rate or supported network standard.
At the bottom of the screen, you can visualize the signal strength levels for each one of the detected networks, along with the operating channel and frequency (2.4GHz or 5GHz) for each network.
You can pause or stop a scan completely once you have finished.
3. Analyze the results
After the data capture process is complete, you can proceed with the site survey analysis.
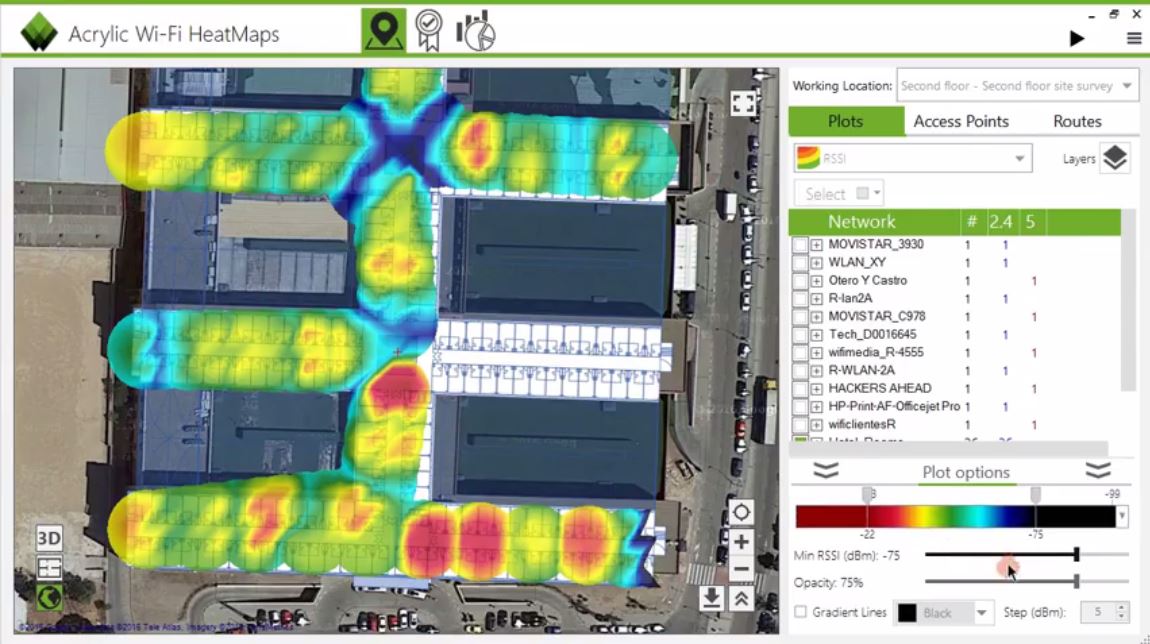
To create a wifi heatmap, go to the “Plots” tab, select the type of map you want to generate, and choose the applicable network(s) you want to visualize.
In this videotutorial, we can observe how the Hotel Rooms network’s signal strength heatmap is being created.
However, you can create many more heatmap types, such as the channel coverage heatmap.
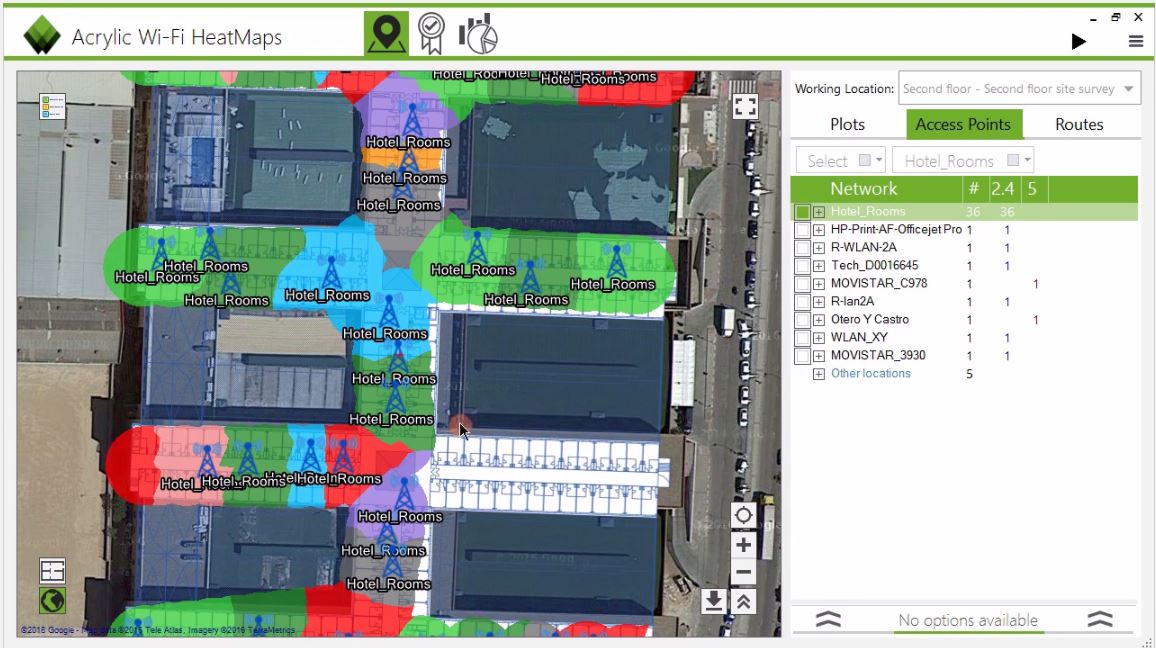
To add some context to this plot, you can display the location of the different access points on the map.
Using the “Plot” options, you can modify the color scheme to display maximum and minimum signal strength levels, define minimum thresholds, and adjust opacity according to your needs.
4. Create professional wifi site survey reports
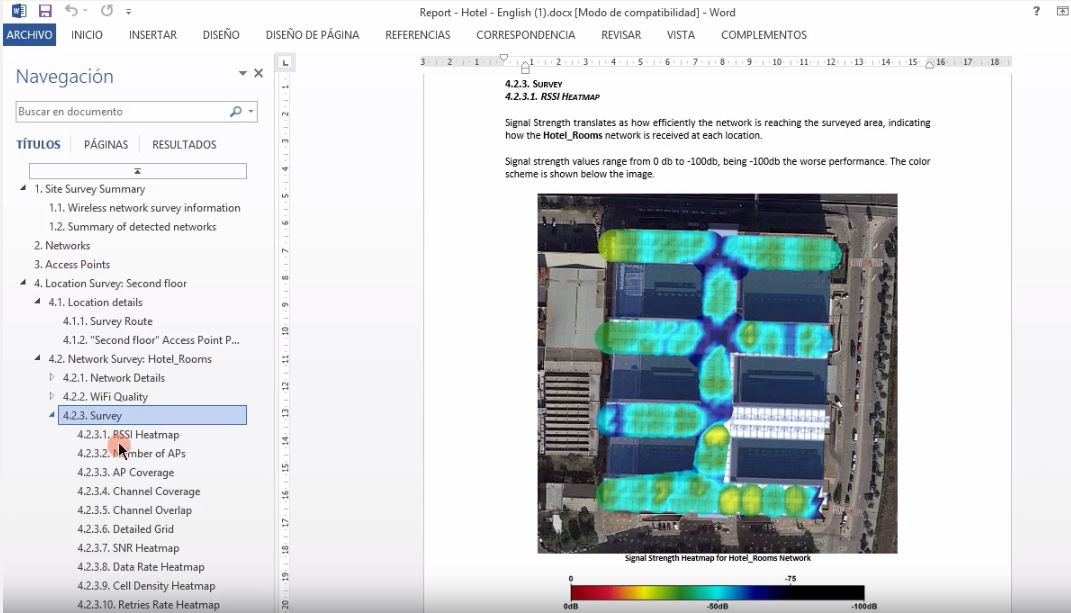
An Acrylic Wi-Fi report is the best way to document your wifi site survey.
This document offers complete information on the general status of our wireless network at a glance. You can analyze from the detailed information on the selected networks to the different heatmaps that were generated during the site survey.
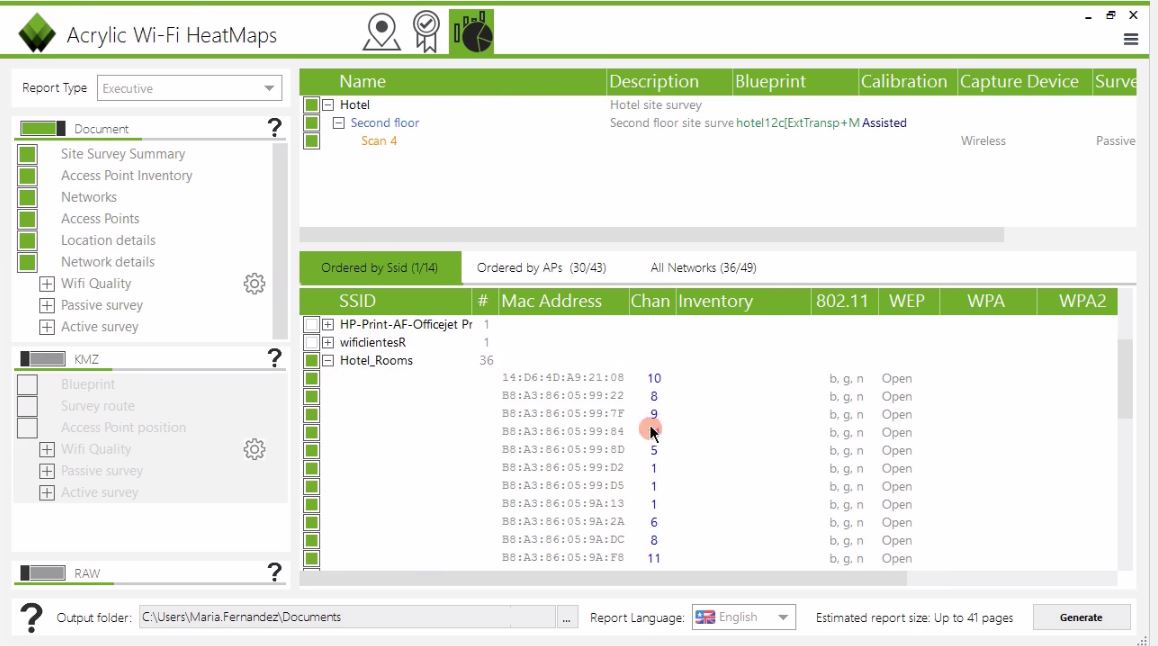
Once all the collected data in the site survey has been analyzed, you can create professional reports for your project, to either deliver to a client, or for internal corporate use.
As for the detail level, Acrylic Wi-Fi allows you to generate an executive report, containing a project’s overview plus graphics, a technical report, that additionally includes heatmaps, or a complete report, that offers all the information in a much more granular way.
At the right side of the screen, you can see the current project’s information, where you can select all components to be included in the report: surveyed locations, scans, and networks.
After that, select the type of report to generate and the desired level of detail.
Reports can be created in editable Word format, in KMZ format to visualize the data on Google Earth, or in CSV format, that opens on a spreadsheet application.
Finally, select the target folder for the document and the desired report language.
You can download our free trial version from here!