
WiFi Heatmaps
Increase WiFi performance
Design, audit, visualize, diagnose, ... Perform all the processes of planning, site survey & improvement of a wifi infrastructure with Acrylic WiFi Heatmaps. Now with WiFi 7.
Study the WiFi coverage
Acrylic WiFi Heatmaps is a tool for WiFi planning and WiFi site survey. It allows for designing, analyzing, and easily detecting WiFi problems as well as generating reports. It works with all WiFi standards, including WiFi 7.
Planning WiFi
Design the WiFi network easily, calculate how many access points are needed, and reduce the deployment cost of the network.
Site survey
Analyze your WiFi infrastructure with automatic coverage study and generate heatmaps with up to 15 different parameters.
Wifi Quality Optimization
Define the performance you need from your WiFi network, identify weak points, and obtain an overall assessment of your setup and how to improve it.
Report generation
Document the results of your study with automatic reports, tailored to different profiles (executive, technical, and comprehensive).
Network design & site survey features
Wifi7
Support for all standards, including WiFi 7 on all frequency bands 2.4, 5, and 6 GHz.
Indoor and outdoor study
Not only for indoor plans, analyze vast geographical areas and conduct WiFi coverage studies in Smart cities.
RF spectrum analyzer
Check for interference of all types in the radio spectrum with Oscium compatibility.
Extremely Easy
Designed for use without the need for technical expertise
Multiple metrics
Signal strength, interference and channel overlap, SNR, coverage per channel, and many others.
GPS
Locate devices using GPS.
Editable reports
Multiple formats for multiple needs (DOCX, CSV, KMZ) and in multiple languages
And much more...
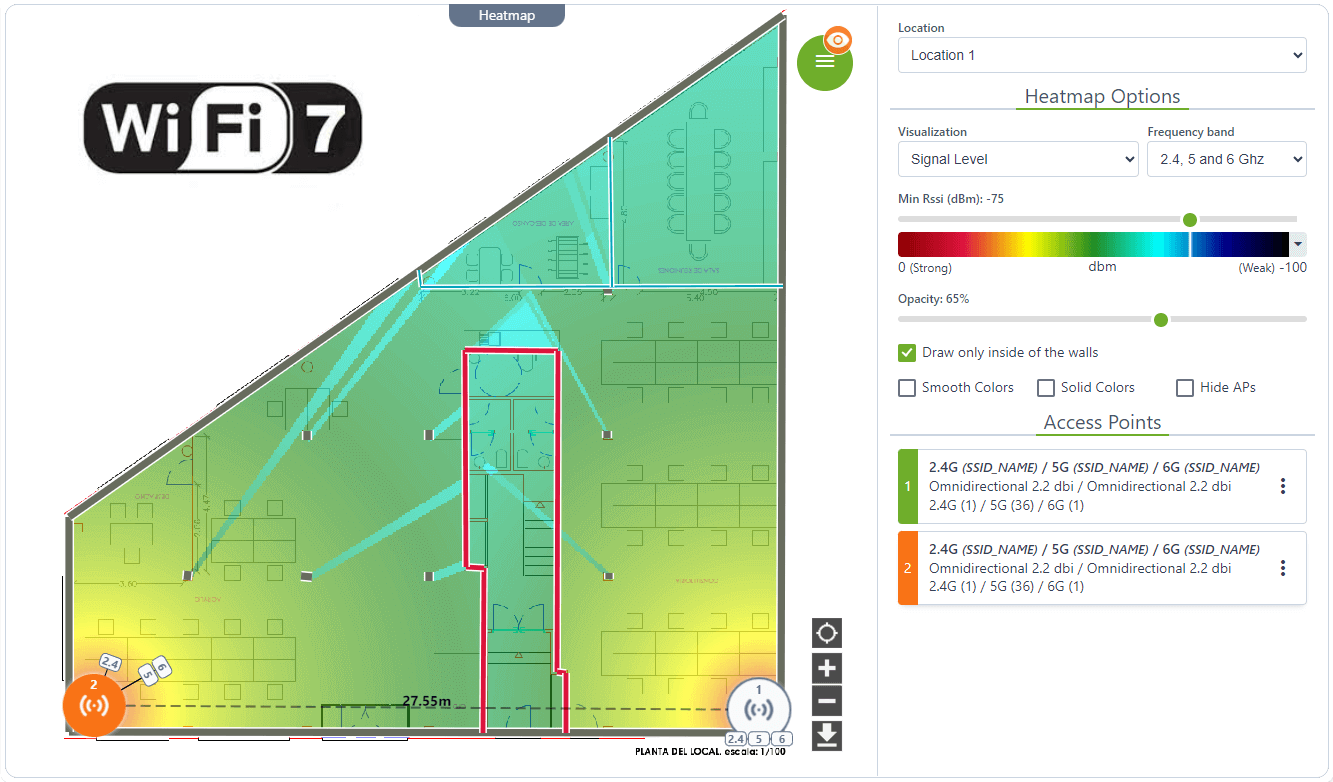
Design and planning of wifi networks from scratch
Design and plan from scratch a wifi network, identifies the best location where to install the access points and orientation of the antennas to correctly cover the entire perimeter ensuring maximum performance and coverage of the wireless network.
Draw walls and building elements.
Multiple materials to adjust the blueprint to reality.
Select the access point in 2.4, 5 or 6Ghz.
Configure antenna type and propagation wave.
Orients and positions access points in plane.
View the coverage heat maps of the simulation wifi.

- Add the walls to the plan
- Add the APs to the map and position them
- Configure APs (Frequency, antenna, channel, etc.)
- View heat maps (Coverage, interference, etc.)
Start planning your installation
Design your Wi-Fi network for the best performance in just 4 steps
Site Survey software
Calibrate blueprints online. (Indoor and outdoor survey).
RF WiFi spectrum Analyzer support (2.4, 5, and 6Ghz).
Displays coverage and heat maps in high resolution.
Create 15 different types of heat maps, also in 3D.
Analyzes WiFi signal and coverage quickly.
Active and passive WiFi site survey (iPerf support).
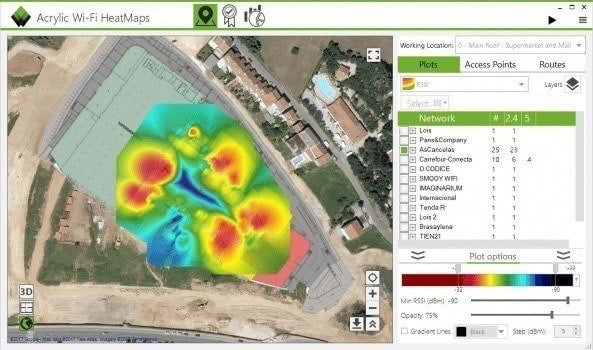
WiFi coverage analysis - site survey
Evaluates the correct deployment of any 802.11be, 802.11ax, 802.11ac and 802.11n wifi network.
Get visually all the information you need to represent: signal level (RSSI), SNR, AP and channel coverage, radio spectrum (RF), device density, signal overlap and many more. See how easy it is to carry out a Site Survey with Acrylic Wi-Fi Heatmaps in this article where we conducted a site survey on a 4-storey hotel.
Conduct a study of your Wi-Fi network
Analyze the coverage and quality of your installation in the easiest way.
Wi-Fi Quality
Identify problems and deficiencies in your network and define the necessary changes to solve them through profiles oriented to your needs of use.
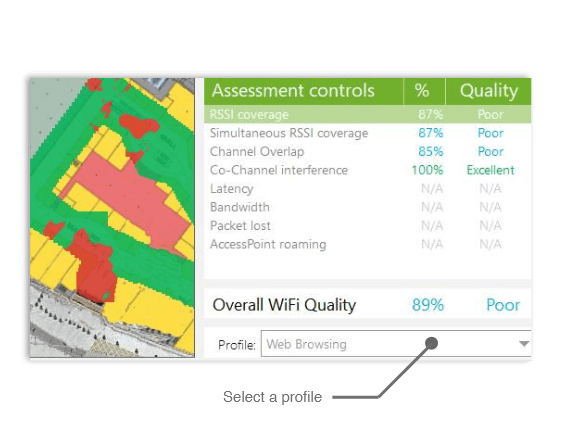

Wi-Fi Quality module includes two default profiles: Web browsing and VoIP, with parameters pre-configured by our Wireless optimization experts who analyze the suitability of the wireless network to support proper web browsing and Voice over Wi-Fi calls. You can also define additional quality controls to adjust to your standards.
In the visualization map, those zones in which the optimal levels are fulfilled to support a correct navigation and calls on Wi-Fi, are shown in green, the zones in which the levels are not reached are shown in red.
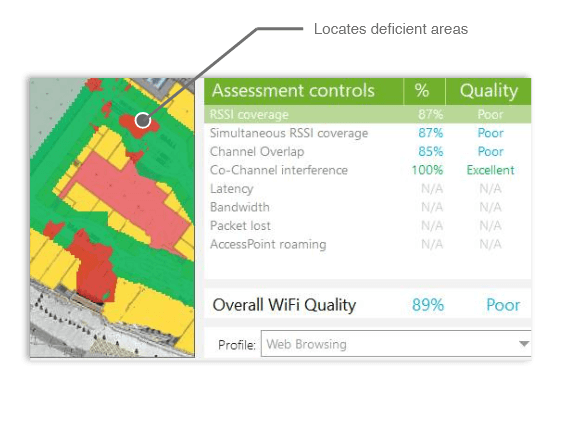
Troubleshoot problems in your deployment
Improve your network coverage with Acrylic Wi-Fi Heatmaps advices.
Report Generator
Obtain a complete inventory of analyzed devices and generate detailed editable reports with heat maps and coverage maps in Word and CSV format and export results to Google Earth.

WiFi site survey report
Get the most comprehensive results automatically in various formats (Word, CSV, KMZ) to evaluate the correct deployment of WiFi infrastructure and edit them as needed.
Do you need to present a WiFi site survey report to a client or do you want to process the data collected during the coverage analysis in a clear and detailed way? Acrylic WiFi Heatmaps does it for you in one click. Reporting a WiFi site survey has never been easier.
Download sample reports in multiple formats!


Executive and detailed survey reports (in word .docx file).
Export results to RAW (csv) and KMZ (Google Earth).
One-Click WiFi Consulting Reports
Wireless network analysis reports are a great way to organize the data collected during a coverage analysis to provide the report to clients, as well as to save the data for a later review. However, creating these reports manually is both highly time and resource consuming. With Acrylic Wi-Fi Heatmaps, you will be able to use your valuable time on other important things while the software takes care of the most detailed and comprehensive reports on all of your site survey projects.
Just open the Report section on Acrylic Wi-Fi Heatmaps, choose the report type to create (Executive or Technical), customize the sections that you need, select report language and format, and download the document.
Coverage analysis reports can be created in .DOCX, .CSV, and .KMZ format, and they are available in Spanish, English, French and German.
Forget about non-editable PDF’s. You will be able to
Preguntas frecuentes sobre Acrylic WiFi Heatmaps
▶What is a WiFi heatmap and what is it used for?
▶How can a WiFi heatmap be created with Acrylic WiFi?
▶What types of WiFi heatmaps can be generated with Acrylic WiFi?
▶What information does a WiFi heatmap provide?
▶What are the main features of Acrylic WiFi Heatmap?
Would you help us by sharing our product on social networks?