SNR/Wi-Fi signal strength map
Generate a wifi SNR map to calculate the wireless signal quality
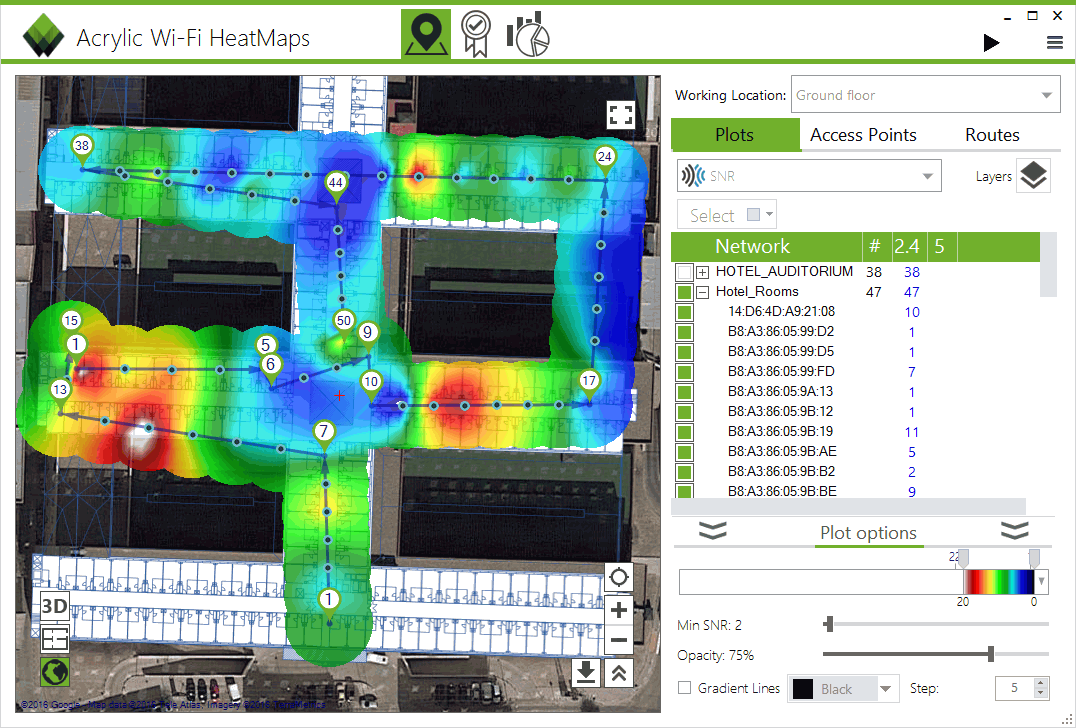
A wifi snr map, or signal strength map, is quite similar to a Wi-Fi coverage map (heatmap), but this type includes Wi-Fi signal to noise ratio when graphically displayed.
Wi-Fi SNR data collection and map generation features are now included in the latest version of Acrylic Wi-Fi Heatmaps wireless coverage analysis software.
Signal to noise ratio (SNR or S/N) is defined as the proportion between the propagated signal strength and the interfering noise power. SNR is measured in decibels.
How to obtain the measurements
This Wi-Fi signal strength map is generated during a passive site survey by measuring Wi-Fi signal strength and Wi-Fi interferences to help identify well performing areas with stronger Wi-Fi signal.
SNR signal level is calculated as the difference between signal strength and noise (SNR stands for ‘Signal to Noise Rate’). These values are required to generate Wi-Fi signal strength maps.
The higher the value, the better the user experience, transmission speed, and Wi-Fi communication stability.
The generation of this type of map requires measurements using Acrylic Sniffer or an Airpcap NX card set on monitor mode.
Wi-Fi Signal Strength Map Color Scheme
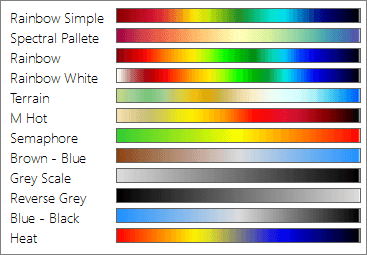
Wi-Fi heatmaps, such as wifi snr map, are represented using color schemes that can be configured for better visual results.
There are 11 color schemes available for signal strength representation.

A Wi-Fi coverage report generated in an Acrylic Wi-Fi Heatmaps Wi-Fi site survey comprises all these maps, including Wi-Fi signal strength map by default, along with many others.
Also included is the automatic WiFi signal quality map, and many more.
Are you ready to give Acrylic Wi-Fi Heatmaps a try?
Try all our Acrylic products, simply download them from the web and start using them.
The trial version is fully functional for 15 days.

