
Signal strength, noise, location and area covered by an access point
Table of Contents
Access point signal noise ratio, strength, location, and coverage area
When evaluating the results of a Wi-Fi network deployment, the parameters to are usually analyzed are access point coverage, signal strength (RSSI) and signal to noise ratio (SNR).
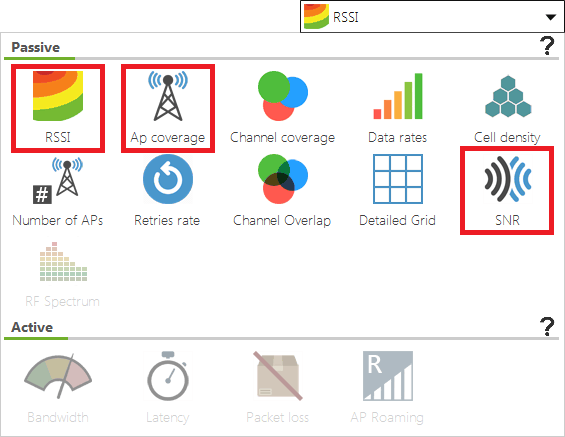
An access point location map showing signal strength values should reveal if the access points are properly propagating the network, or if the network performance and coverage are not meeting the theoretical expectations.
For a Wi-Fi infrastructure, either a new or an existing deployment, the expected theoretical network performance values are not always achieved in practice.
Usually, the layout of the installed wireless network is positioned over the location blueprint, covering at least the following details:
- Location of the access points.
- Covered area by each one of them.
- Signal strength values (dBm).
- Signal to Noise Ratio (SNR) in that area.
How to Work with drawings or blueprints of the installations to measure the signal-to-noise ratio.
The blueprints should be clear and the most up-to-date possible to avoid discrepancies that may lead to incorrect readings at the time of performing the data capturing process.
It is recommended to set the blueprint background and surrounding area as transparent to work more comfortably.
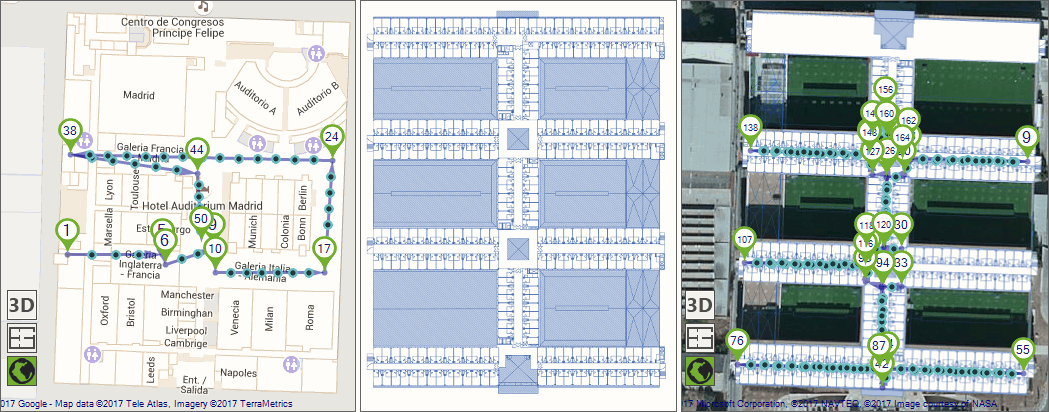
Site survey overlapping hotel floor plan.
How to Determine Access Point Locations
Once the site survey has been performed across the building, access points will be automatically located on these floor plans or blueprints, based on the survey readings.
This way, access point location can be estimated with a high degree of accurateness, which is particularly helpful when the access points are not visible for being positioned over false roofs or hidden behind other constructive elements.
Location of access points.
If the location is known and there are any positioning discrepancies, the access point can be moved to adjust it to the exact location for a more accurate network mapping.
How to Generate Signal Strength and signal-to-noise ratio Coverage Maps
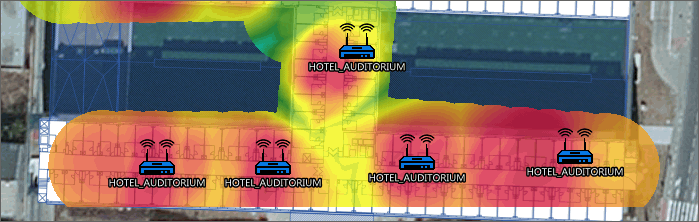
Based on the measurements, we will obtain an individual coverage map for each access point, as well as a comprehensive coverage map. This is interesting when evaluating proper coverage for each access point independently and all access points comprehensively.
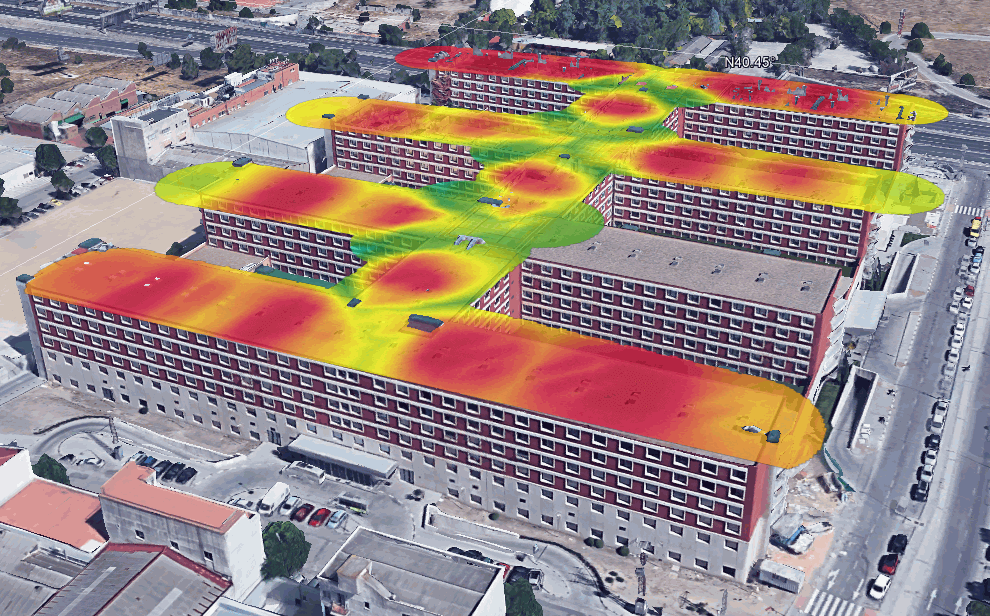
Access point signal strength heatmap as seen on Google Earth
This can be visualized on a heatmap, and by using Acrylic Wi-Fi Heatmaps‘ Wi-Fi Quality module, you can automatically evaluate if all parameters are met, based on the network profile requirements.
How to Validate a Correct Wi-Fi Infrastructure
Signal-to-noise ratio values can also be visualized as a heatmap from the Wi-Fi Quality module.
The two-colored graphic shows correct coverage area in green and incorrect coverage area in red.
By analyzing both signal strength and signal-to-noise ratio (SNR) among other parameters, which is a real time saver when analyzing and validating the measurement results.
Therefore, if a first analysis does not meet the expected network quality standards.
You can still clearly visualize those areas that need to be improved and the access points that need to be repositioned or have their settings reconfigured to improve network coverage, signal quality and overall user experience.
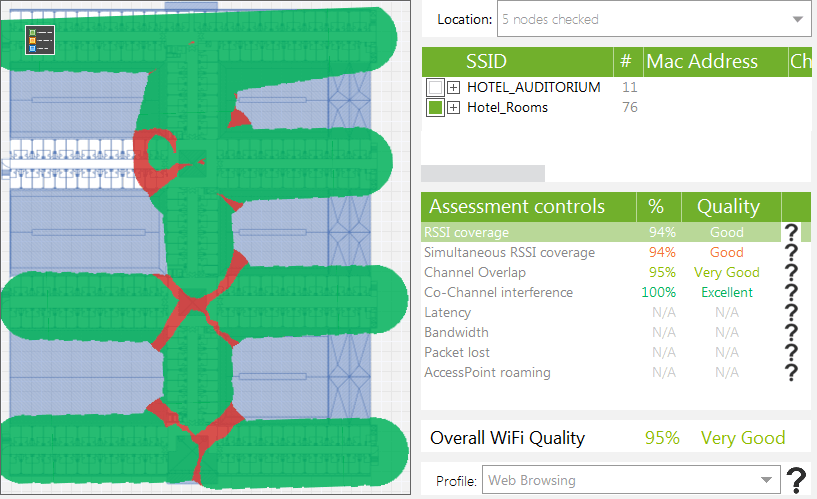
Wireless network coverage automatic validation
How to Generate Support Technical Memory for a Project
The last step in a site survey project is to generate the project’s support technical memory for wireless connectivity improvement and validation.
When using Acrylic Wi-Fi Heatmaps, thanks to all the plots, heatmaps, and other elements provided, you can automatically generate reports.
These reports are based on the performed measurements, Wi-Fi standards, network operating frequency bands, configuration, security, etc.
If you need to know the network’s maximum download and upload speeds, these values can be obtained after performing an active site survey.
These reports can contain different levels of detail, depending on the selected report type, such as an Executive report where only the results are shown
Also you can generate more detailed or technical where, besides the results, the measured values are further analyzed.
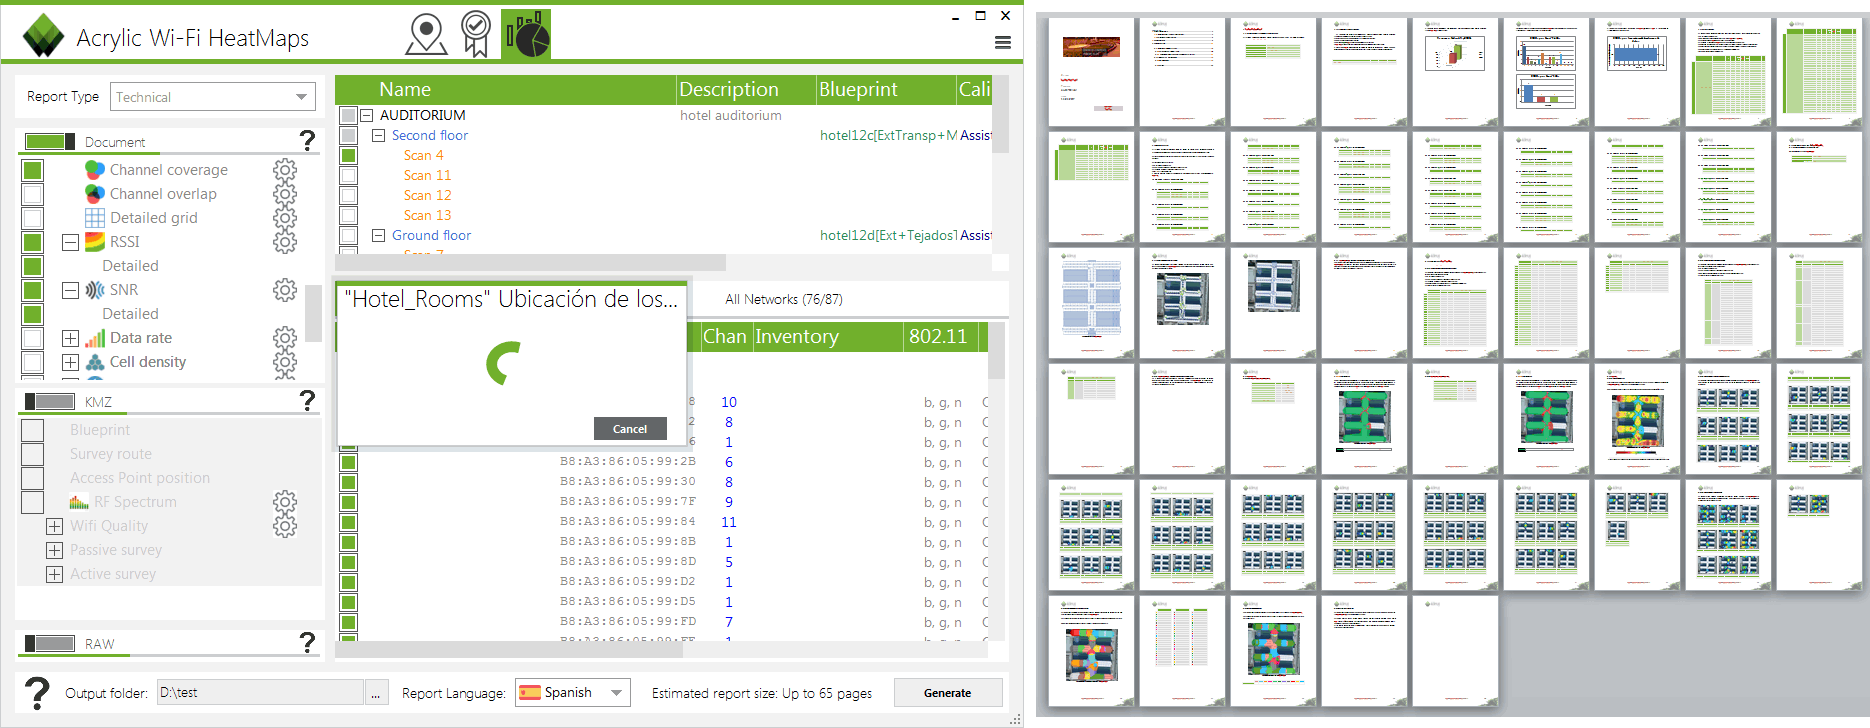
Support technical memory in an editable format by individual access point.
By following these simple steps, you can easily perform the measurements and results validation for any given wireless network.
For a new network deployment, network performance is verified to meet the quality standards, or otherwise new measurements are taken on the underperforming areas through a new site survey to verify compliance. This process can continue until all Wi-Fi network performance issues are solved. For an existing project, the network is checked for possible issues, and the process continues likewise.
Try Acrylic Wi-Fi Heatmaps NOW and validate your wireless infrastructure