
AP Coverage – Access point coverage map
An AP coverage map shows the Wi-Fi coverage range propagated from each AP (Access Point) over a blueprint or satellite map to help determine individual AP signal strength. This type of maps are particularly useful when a network infrastructure deployed in a building or ever an extended area has several access points.
The information presented on a Wi-Fi coverage map, or WLAN heatmap, on a multi-AP network does not differentiate which individual AP has the strongest Wi-Fi signal within a certain coverage area, since all measurements are collectively represented for all selected AP’s combined. Therefore, a coverage map shows detailed information on the Wi-Fi signal distribution within the radio-electrical space, defining the area of influence of each Wi-Fi access point.
Coverage Map – Visualizing AP Coverage Areas
The following image depicts an AP coverage map in a 16-AP Wi-Fi network infrastructure, show individual AP coverage areas by color. 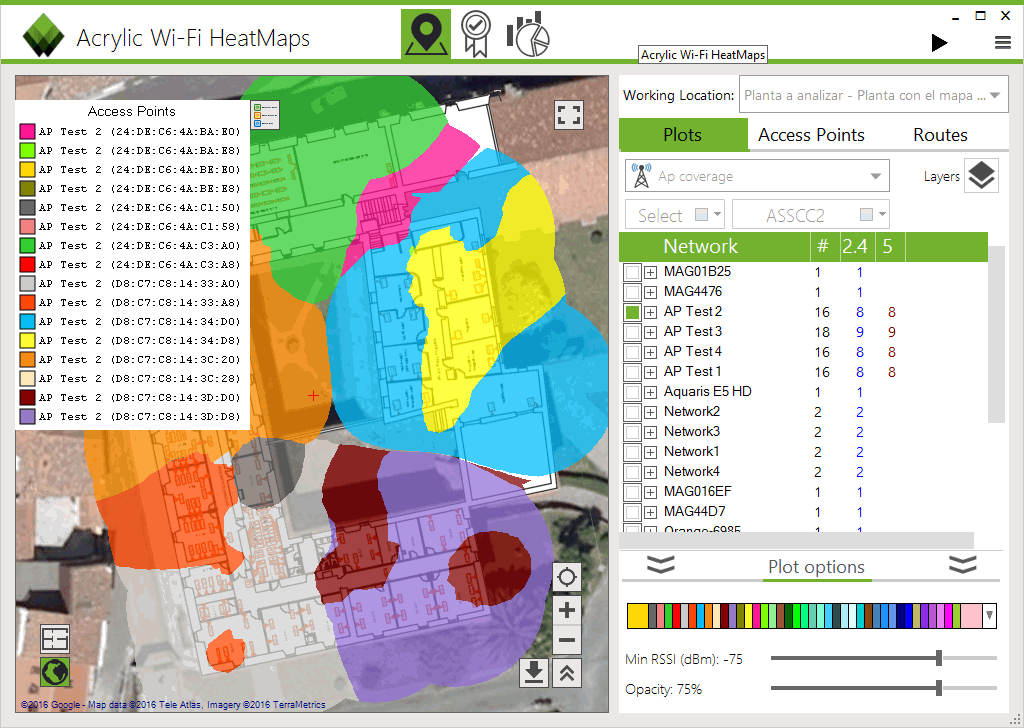 The identification of isolated and reduced coverage areas on an AP coverage map, where the strongest signal comes from a distant AP, helps in a more efficient Wi-Fi network deployment to avoid unnecessary roaming between clients and AP’s, improving signal stability, and subsequently, Wi-Fi connection speeds.
Download your fully functional 1-moth trial version of Acrylic Wi-Fi Heatmaps and start analyzing your network’s individual access points coverage.