
Interpret wifi planning, how to understand results
Table of Contents
Interpret wifi planning in an easy and simple way
It is necessary to interpret wifi planning in order to get the most out of a new wifi installation and deployment.
Before starting any WiFi deployment it is necessary to plan in advance the configuration and position of all APs. This task is called ‘planning WiFi‘ or ‘Predictive WiFi survey‘. With Acrylic Wi-Fi Heatmaps it is possible to carry out this planning in the pre-deployment phase. The software will simulate the APs signal taking into account their configuration (antenna, orientation, emission frequency and power) and the interaction of the signal with the defined constructive elements such as walls, doors, windows, etc. You can find more information on how to make a WiFi planning here. This article will focus on the interpretation of the results obtained.
Once the first approximation on the APs location and configuration has been made, its suitability must be studied. To do this, the options available in the “Visualization” drop-down will be used:
- Signal level
- Number of APs
- AP Coverage
- Channel Coverage
- Signal-to-Interference ratio
If the analysis show a poor result, the initial approach should be modified and the process repeated until the necessary requirements are met.
How to interpret wifi planning to ensure that everything is correct
It will depend on the requirements we have to meet. Different installations will have different uses and requirements. For a hotel it will be enough to have an acceptable coverage within the areas with guests. On the other hand, inside an office where VoIP communications are common, it is necessary that the workstations have a good coverage. In a hospital, redundancy will be critical, which implies having at least two APs with acceptable coverage in the areas where wireless monitoring is being performed.
To summarize, in order to know whether the planning meets the demanded requirements or not, it will be necessary to check the following visualizations:
Signal level
Displays the expected RSSI (Received Signal Strength Intensity) of a zone. WiFi communications need good signal strength, so it is important to distribute APs in a way that the areas of interest have good coverage. It is considered an acceptable RSSI -75dBm, and a good one starting at -65dBm.
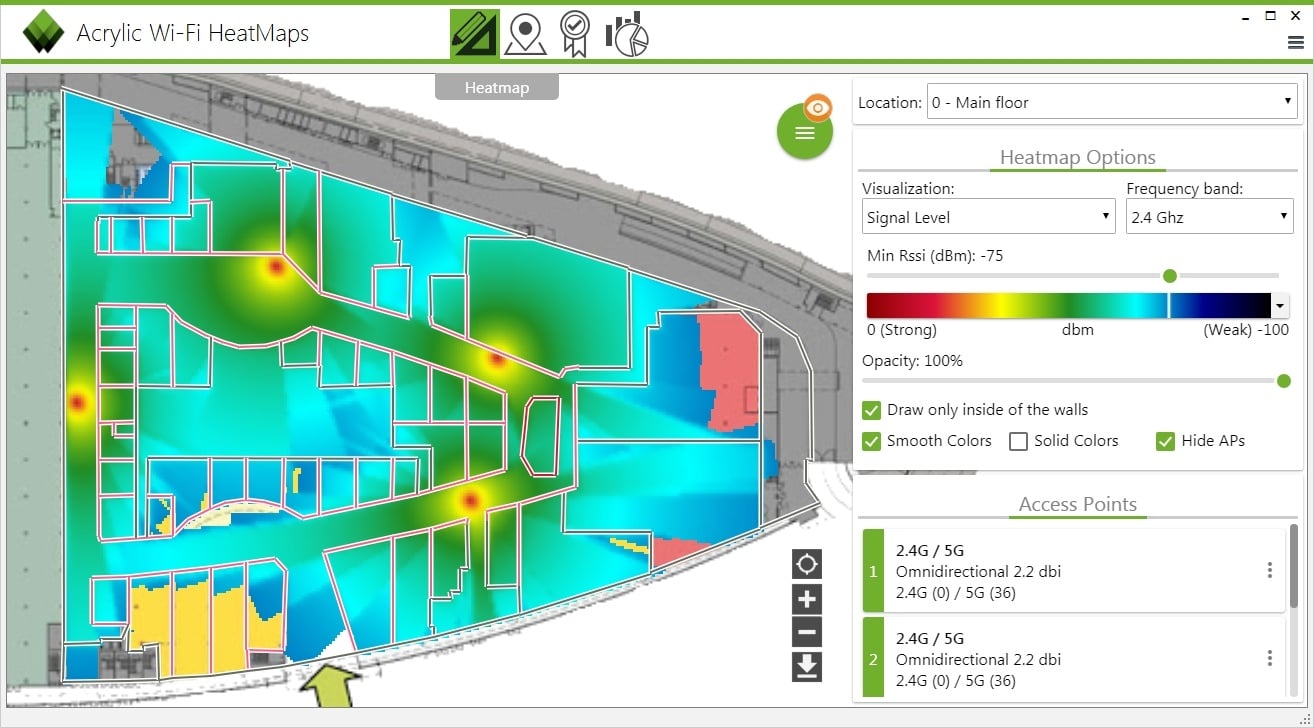
When placing APs to cover all areas it is possible that many of them will end up too close to each other. In these cases we must be careful with the channel configurations because interferences can significantly degrade communications. This will be shown below in the “Signal-to-Interference” section.
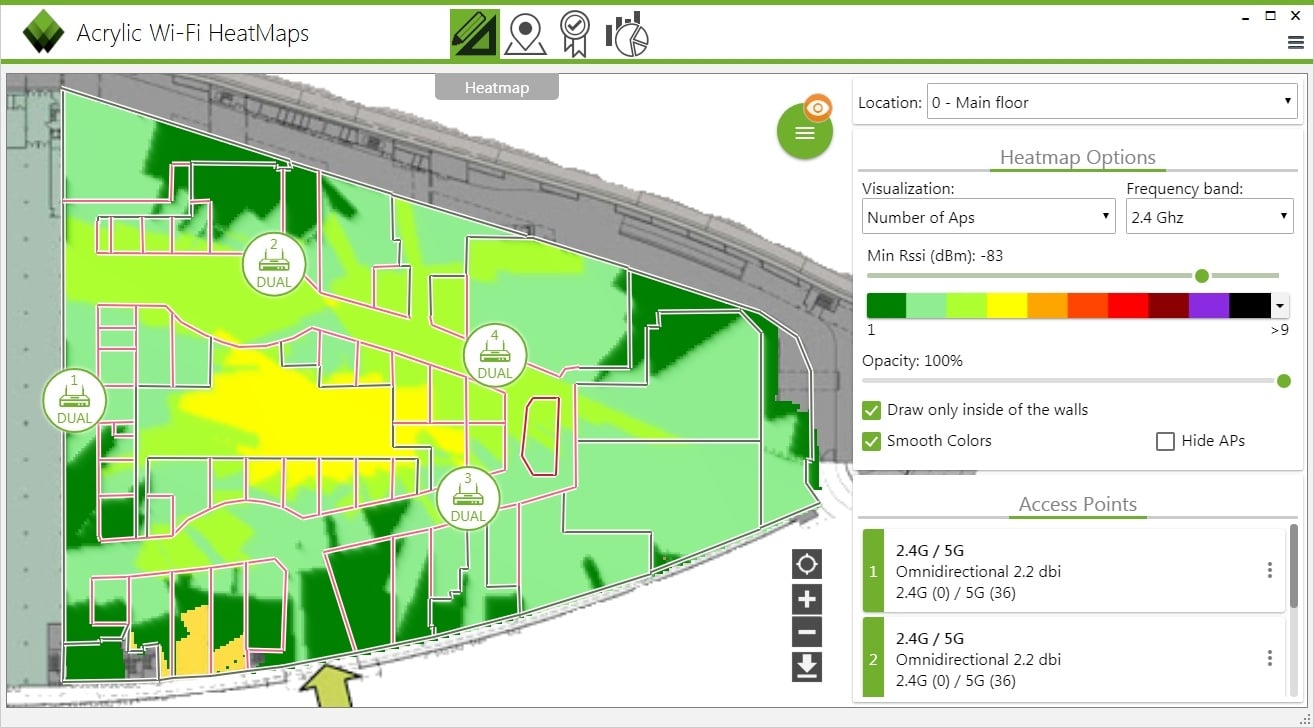
Number of APs
This shows the number of available APs in each zone with at least -75dBm of RSSI (this parameter is configurable in the right panel bar ‘Min Rssi’). You can visualize the available redundancy. Let’s take as an example the case of a hospital that requires communication redundancy and VoIP support. ‘Min Rssi’ should be set to -55dBm (recommended RSSI for VoIP). We should check that at least two available APs should be available within the areas of interest with that signal strength. These zones are marked in light green. You can see the legend in the right panel or display the number of available APs by hovering the mouse over the map.
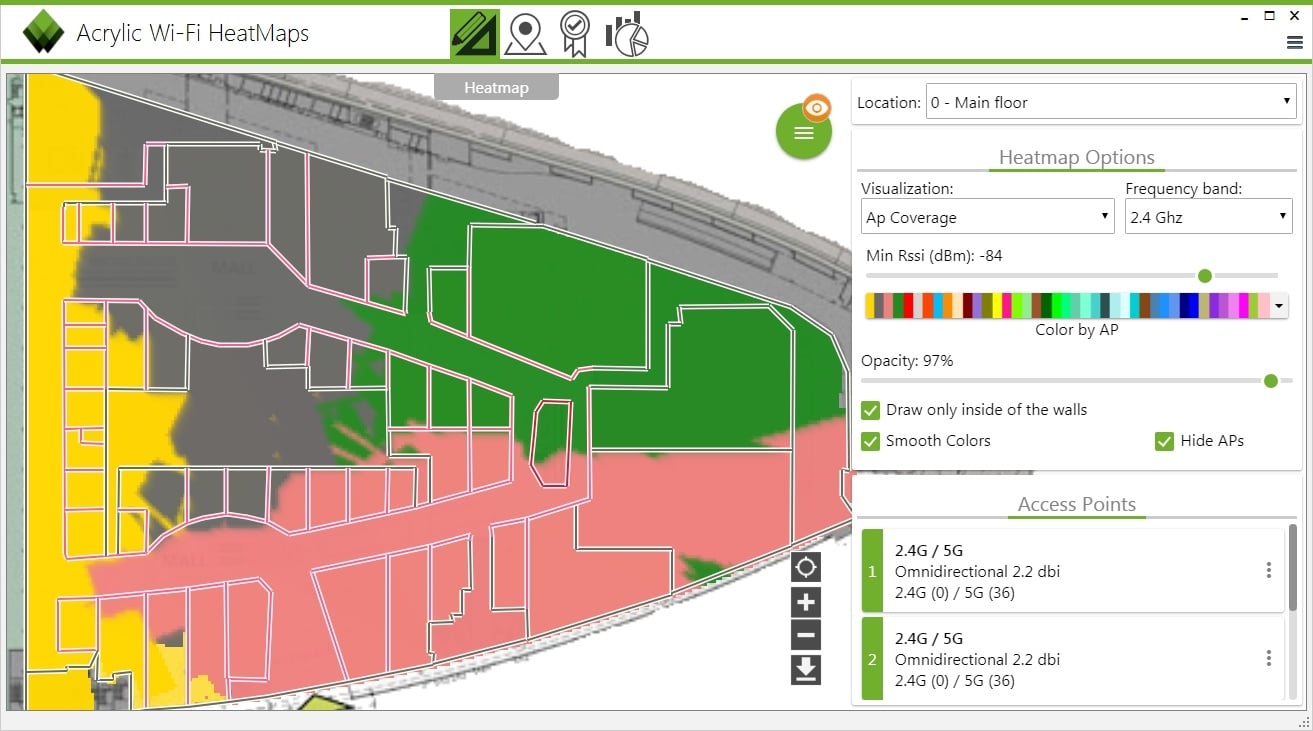
AP Coverage
This option shows the area of influence for each AP. That is, the AP that is received with the best signal in each zone. This visualization makes it possible to visualize the area covered by each AP, allowing the identification of those that, due to their small radius of action, are being underused.
Underutilization of APs should be avoided since it means increasing the installation costs without an optimal return in performance. For these cases it is advisable to reorganize APs in a way that this underutilization is minimized.
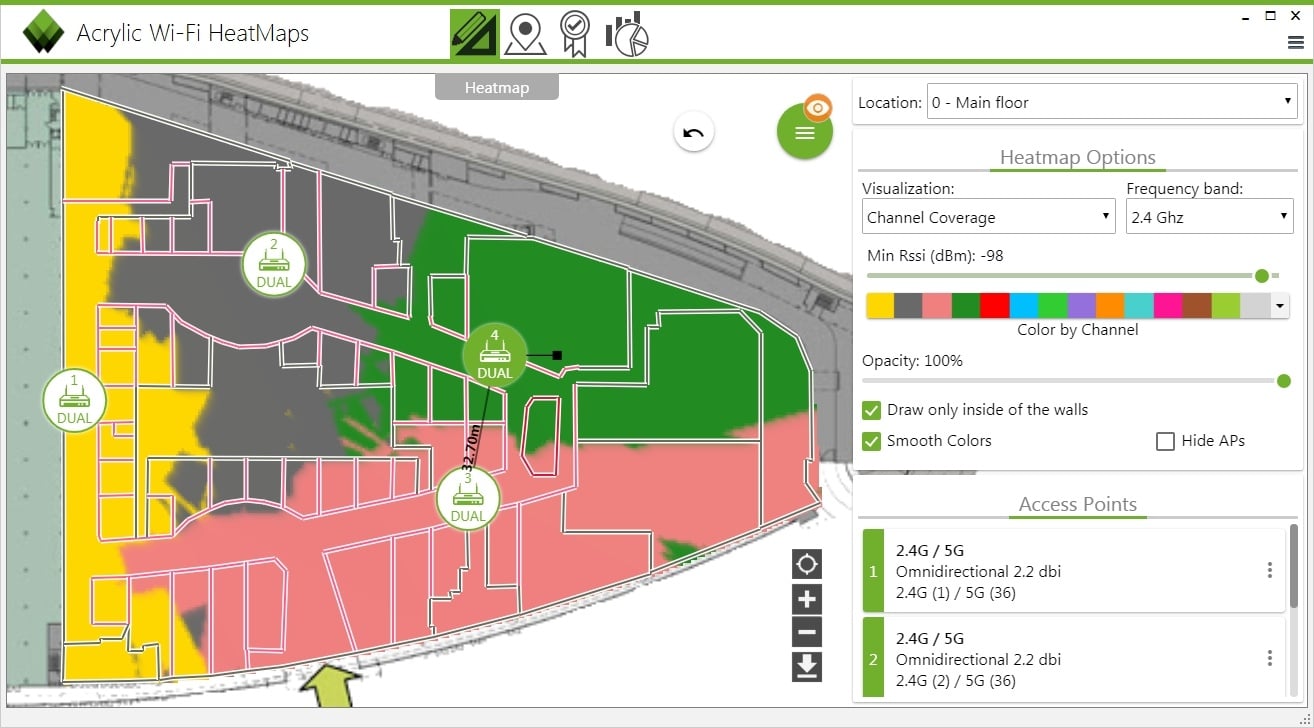
Channel Coverage
This option shows which channel is used within each zone. This helps to organize APs to avoid interferences, since contact between zones with nearby channels will cause interferences and degradation of network performance. The wider the channel width used in networks, the more separation between channels will be necessary.
For example, networks with 20Mhz channel width will operate without interferences as long as they are separated by five channels. That is, two APs that are configured on channels 1 and 6 will operate without degradation. However, if the networks are operating with 40Mhz width, a separation of seven channels will be required to avoid interference.
Signal-to-Interference ratio
This option shows areas that will suffer performance degradation due to interferences with other APs.
In order to function properly, APs must be configured with sufficient separation between channels, so that communications do not overlap.
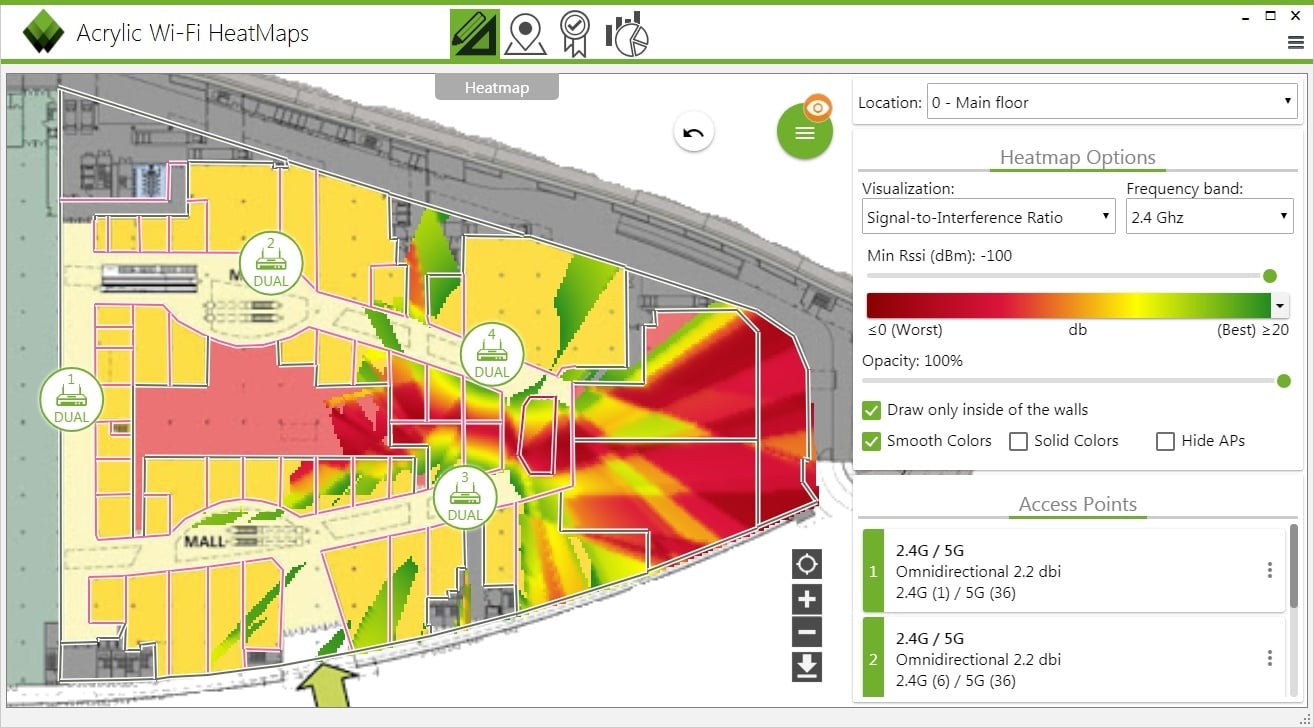
In the image above you can see areas with strong interferences (marked in red) due to the proximity of APs 3 and 4 that are transmitting in the same channel.
To avoid this, it is necessary to rethink APs configuration and position until all areas of interest are free of interferences.
interpreting wifi planning is easy and simple
This article is part of a series of articles about Wifi planning and design
- wifi planning, Design and locate access points in a simulation.
- Interpret wifi planning, how to understand results