Acrylic WiFi Heatmaps User Manual
1. Introduction to Acrylic Wi-Fi Heatmaps
Introduction
Acrylic Wi-Fi Heatmaps is a site surveying tool designed for providing wireless network coverage mapping and RF spectrum analysis. Using Acrylic Wi-Fi Heatmaps, you can perform Wi-Fi infrastructure measurements to analyze actual Wi-Fi network coverage and performance.
The collected data is used to identify, quantify and diagnose all issues affecting wireless communications health and performance.
Acrylic Wi-Fi Heatmaps analyzes the Wi-Fi networks within range to diagnose their working mode and performance, exposing all found issues and limitations under current network configurations.
This User Manual is meant to guide you through all Acrylic Wi-Fi Heatmaps functionalities, its user interface, and how to use it. Furthermore, it provides detailed information on how to diagnose and read wireless network coverage study results.
1.1. System Requirements
Acrylic Wi-Fi Heatmaps system requirements are listed below
|
Operating System |
Windows Vista (32bit, 64bit) Windows 7 (32bit, 64bit) Windows 8 (32bit, 64bit) Windows 8.1 (32bit, 64bit) Windows 10 (32bit, 64bit) |
|
Library Prerequisites |
Microsoft .Net Framework 4.5 (Included by default in Windows 8.1 and later versions) |
|
Processor |
1.5GHz (multi-core recommended) |
|
Memory |
2Gb RAM (4Gb recommended) |
|
Disk Space |
40MB for Acrylic Wi-Fi Heatmaps full installation, plus 500MB extra disk space for reports (+1 GB recommended) |
|
Wireless Cards |
Only required on the equipment performing |
1.2. Supported Hardware
1.2.1. Wireless Cards
Acrylic Wi-Fi Heatmaps supports the use of any commercially available wireless card by making use of Windows native mechanisms to perform Wi-Fi measurements.
Moreover, Acrylic Wi-Fi Heatmaps operates on an advanced capture mode called Monitor Mode, also known as Promiscuous Mode that offers a series of additional features when performing the measurements.
When a wireless card is operating on Native Capture Mode, it reveals the Wi-Fi signaling packets sent by the access points. On Monitor Mode, Acrylic Wi-Fi Heatmaps is able to extend its data capturing capabilities, providing the additional feature of displaying all client devices connected to a wireless network access points, such as smartphones, tablets, laptops, etc.
It is possible to use multiple Wi-Fi devices simultaneously, being one of them connected to a Wi-Fi network to obtain connection related information, such as latency, bandwidth, and roaming values (active site survey), while a second adapter can be set to work on normal mode or Monitor Mode to collect information and operating parameters on other Wi-Fi networks within range (passive site survey).
The selection of the Wi-Fi adapter is an important task to ensure both dependability and long term data validation. To operate on Monitor Mode, there are two groups of wireless cards supported by Windows:
1.2.1.1. Monitor Mode compatible Wi-Fi Hardware (NDIS)
Wi-Fi hardware supporting Monitor Mode on Windows is affordable and commercially available. These are standard wireless cards which have been verified to work using the NDIS driver included in Acrylic Wi-Fi Heatmaps to capture wireless network traffic on Monitor Mode.
Some wireless card drivers may not provide correct information on signal strength or broadcasting channel, limiting their use for Wi-Fi coverage mapping.
For an up-to-date list of supported devices, visit our support section at: https://www.acrylicwifi.com/en/wifi-professional/requirements-and-compatibility/
1.2.1.2. Professional Wi-Fi Analysis Hardware (Airpcap)
Airpcap cards by Riverbed support Monitor Mode. Since they are designed for this purpose, they provide good capturing performance.
Airpcap cards are supported by Acrylic Wi-Fi Heatmaps.
● Airpcap Classic – b/g
● Airpcap Tx – b/g
● Airpcap Nx – a/b/g/n
Airpcap cards software can create virtual Wi-Fi adapters, allowing the use of multiple wireless cards simultaneously with Acrylic Wi-Fi Heatmaps.
1.2.2. GPS Devices
The use a GPS device allows Acrylic Wi-Fi Heatmaps to automatically detect an exact user location when performing a measurement. Acrylic Wi-Fi Heatmaps supports any GPS device using the NMEA communication protocol, as well as those built-in GPS devices in tablets and other mobile devices using mix location.
USB GPS devices create a serial port through which GPS data can be read. To configure this port, please check the serial port parameters from the GPS device manufacturer’s User Manual.
GPS coordinates can be also fed into Acrylic Wi-Fi Heatmaps via Bluetooth. Certain GPS devices allow sharing location data wirelessly via Bluetooth. When establishing a Bluetooth connection with one of these devices, Windows creates a virtual serial port that works as if the device is actually plugged to the computer, so this virtual port is configured just as a normal serial port.
Smartphones with built-in GPS devices can share their current location with Acrylic Wi-Fi Heatmaps via Bluetooth. Find the right app at your local mobile store.
It is recommended to make use of this geopositioning mechanism only when an actual GPS device is available. GPS devices such as A-GPS are not encouraged, since, unlike actual GPS devices, they make use of several different data sources for resolving positioning, and they also tend to be somehow less accurate. These mechanisms are:
● Wi-Fi : 30-500m approximately
● Mobile Telephony Cells : 300-3,000m approximately
● IP Address : 1,000-5,000m approximately
GPS devices are classified in two main categories, according to their communication interface:
1.2.2.1. Serial Port
If the tablet or computer has a built-in serial port, also known as COM port, and the GPS device is physically connected to it, then the GPS device will be used to read the geopositioning data.
The latest devices do not come with COM ports; therefore USB/Bluetooth GPS devices should be used. These devices create a virtual COM port to interact with the host equipment:
● Devices Physically Connected to the host equipment. These devices usually do not require batteries or any external power source. Normally, these are USB devices or PC cards.
● External GPS Devices sharing GPS signal via Bluetooth. These devices are usually conveniently portable. However, they do require batteries, but these are normally integrated long lasting batteries. Two main groups can be identified:
○ Smartphones sharing GPS signal via Bluetooth. The latest smartphones today are provided with GPS and Bluetooth capabilities. Since there are several apps for sharing GPS signal via Bluetooth in the marketplace, no special hardware will be necessary for Acrylic Wi-Fi Heatmaps to use GPS geopositioning.
○ Bluetooth GPS Receptors.
1.2.2.2. Built-in
These are devices that include native integrated GPS, such as some tablets and mobile devices, allowing direct GPS data access.
1.3. License
The use of Acrylic Wi-Fi Heatmaps requires a valid license.Acrylic Wi-Fi Heatmaps will not start without a current valid license.
During the license activation process, Acrylic Wi-Fi Heatmaps requires access to the internet.These are the most frequent license activation failure reasons:
● License server cannot be accessed: a firewall, anti-virus software, or a corporate proxy could be blocking Acrylic Wi-Fi Heatmaps communications.
● Expired license: the license is no longer active and a new license needs to be purchased.
● Invalid license.
● Inactive license.
1.3.1. License Types
Acrylic Wi-Fi Heatmaps has a flexible licensing model that adjusts to each specific site survey needs. For more information on our licensing model, visit our website.
1.3.1.1. Free Trial License
Acrylic Wi-Fi Heatmaps offers users a limited time free trial license to allow them to test the software and make sure it meets their expectations.
This evaluation license is automatically generated when Acrylic Wi-Fi Heatmaps is first started, and it allows using the software for a certain period of time.
During the evaluation period, Acrylic Wi-Fi Heatmaps will display watermarks on all modules.
NOTE: The evaluation license is intended for software evaluation purposes only. These licenses are not meant for commercial or professional purposes.
1.3.1.2. Professional Licenses
For professional use of Acrylic Wi-Fi Heatmaps, a professional licensed should be purchased.
These licenses can be purchased from the Acrylic Wi-Fi website at Acrylic WiFi store, or from an authorized partner. Our partners list is available under the Partners tab in our website.
The Acrylic Wi-Fi Heatmaps licenses are issued on a per user/device basis. The license can be deactivated on a certain device and reactivated on another device, so the user can easily transfer the license to a new computer or tablet to continue using Acrylic Wi-Fi Heatmaps on the new device until license expiration.
Acrylic Wi-Fi Heatmaps allows two simultaneous activations in different devices and 1 or 2 device changes, depending on the license type. Find more information on license types and license activation limits under the “Licenses and Activations” in our website.
There are two licensing models for professionals:
· Temporary Licenses: Acrylic Wi-Fi Heatmaps offers a flexible licensing system based on temporary licenses to meet each user’s specific needs. Depending on site survey project duration and recurrence, the user can choose the license type that best suits his/her needs.
· Lifetime Licenses: Acrylic Wi-Fi Heatmaps also offers lifetime licenses that do not expire, so the user is only required to purchase the license once to use the software forever. This type of license is intended for individuals and companies performing recurrent site surveys that require software availability at all times.
All temporary licenses include free software updates and upgrades. For lifetime licenses, software updates are included in their corresponding Support Contract.
Visit License Page for more information on license types, pricing and support conditions.
However, if any of our licensing models adjust to your specific needs, contact the Acrylic Wi-Fi Team at sales@acrylicwifi.com and we will look into your particular request.
1.3.1.3. Educational Licenses
Tarlogic offers students and professors at educational institutions free licenses for all Acrylic Wi-Fi products.
If you are a university student, you can claim your free educational license. You will only have to register using your email address from your university, college or higher education institution by completing the following form: https://www.acrylicwifi.com/en/blog/free-student-license/
A verification code will be emailed to your registered email address. Using this code, you will automatically get your free educational licenses.
These licenses are for educational purposes only, and they are intended for students and professors to learn about and teach wireless network technologies.
Direct or indirect use of educational licenses for commercial or professional purposes (e. g., network administrators, IT staff) is not allowed according to the terms and conditions of the license.
1.3.2. License Deactivation
As previously mentioned, Acrylic Wi-Fi Heatmaps licenses are intended for a single user, and they can be activated on several equipments of the same user. Once the device activation limit has been reached, Acrylic Wi-Fi Heatmaps will not be able to be licensed on any other device.
Furthermore, licenses can be eventually deactivated. This is especially useful when installing a new equipment or discarding an old one. In these cases, a license can be deactivated from the old equipment to be later reactivated in the new one. Once the device deactivation limit has been reached, Acrylic Wi-Fi Heatmaps will not be able to be licensed on any other device.
The number of activations and deactivations is limited. Please, refer to your license’s terms and conditions for more information.
1.4. Technical Support
Technical support service can be hired during the Acrylic Wi-Fi Heatmaps license purchasing process. This service provides priority communication with the Acrylic Wi-Fi Heatmaps Support Team to address any support request that may arise during a site survey project.
If this service is not hired during the license purchasing process, you can still hire support consulting hours for technical questions on Acrylic Wi-Fi Heatmaps.
2. Getting Started
Introduction
This section covers Acrylic Wi-Fi Heamaps installation and licensing on a Windows system using the installer that can be downloaded from the official download page.
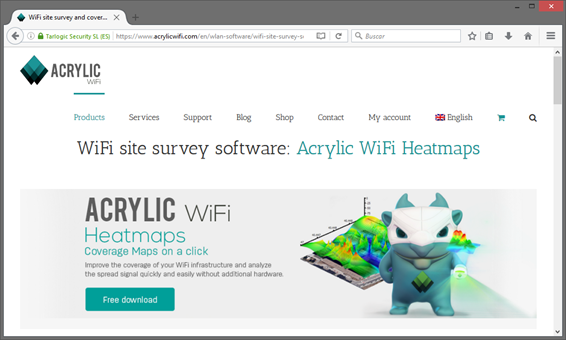
2.1. Downloading Acrylic Wi-Fi Heatmaps
2.2. Installing Acrylic Wi-Fi Heatmaps
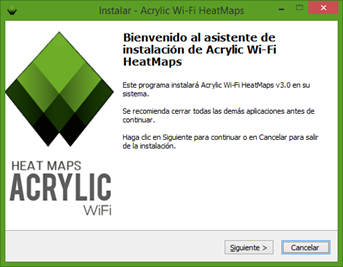
The installer’s name will have the following pattern: Acrylic_WiFi_HeatMaps_vW.X.YYYY.ZZZZZ-Setup.exe, where W, X, Y, and Z correspond to the version build.
Acrylic Wi-Fi Heatmaps do not need special privileges to be installed and operated. However, if you want to install the software in a directory where Administrator privileges are required, you will need to enter your Administrator credentials when prompted. If you do not have Administrator credentials, then select a directory over which you have access to and resume the installation process.
Press “Next” to start installing Acrylic Wi-Fi Heatmaps:
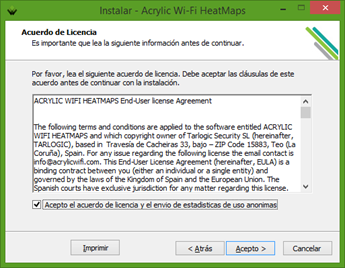
During the installation process, you will have to accept our End User License Agreement (EULA) to proceed. Click on “I accept” to continue:
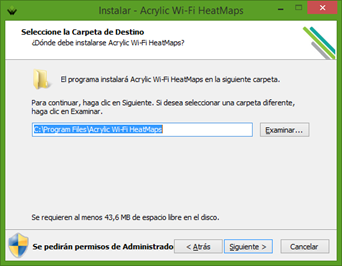
The installer selects a default destination folder for the installation of Acrylic Wi-Fi Heatmaps. You can choose a different folder by clicking on the “Browse” button. Click on “Next” to continue with the installation process:
2.2.1. Reinstalling/Upgrading
To start an Acrylic Wi-Fi Heatmaps upgrading or reinstallation process, run the installer and follow the steps described in the installation section. In this case, if an existing Acrylic Wi-Fi Heatmaps installation is detected, the installer will proceed to uninstall the previous version.
NOTE: Site survey projects, as well as Acrylic Wi-Fi Heatmaps preferences will not be deleted after the software upgrading or reinstallation.
2.2.2. Uninstalling Acrylic Wi-Fi Heatmaps
Acrylic Wi-Fi Heatmaps can be uninstalled from the Windows’ Control Panel option, “Programs and Features”.
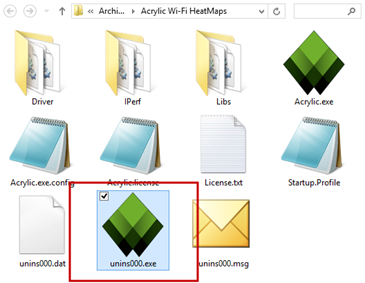
You can also uninstall the software by double clicking on the “unins000.exe” file located in the Acrylic Wi-Fi Heatmaps installation folder.Note that during the uninstalling process you can be prompted to also uninstall the NDIS driver and additional modules. If you are using any other Acrylic Wi-Fi product, we recommended keeping the driver.
2.3. Running Acrylic Wi-Fi Heatmaps for the first time
2.3.1. Starting the Evaluation Period
When you run Acrylic Wi-Fi Heatmaps for the first time, a limited time free trial license is automatically generated for evaluation purposes. This license expires at the end of the evaluation period, or when a license purchased from the Acrylic Wi-Fi online store is validated.
2.3.2. Getting Purchased Licenses
Once you have purchased an Acrylic Wi-Fi Heatmaps license from our online store, you will be sent a confirmation message to your registered email address containing your credentials to access the "My Account" section in our website, as well as the corresponding license code.
In order to access our client area, you are required to enter your email address as your user name and the password in your confirmation message. From our client area, you will be able to download the software and the license codes for your purchased licenses, as well as edit your account details.
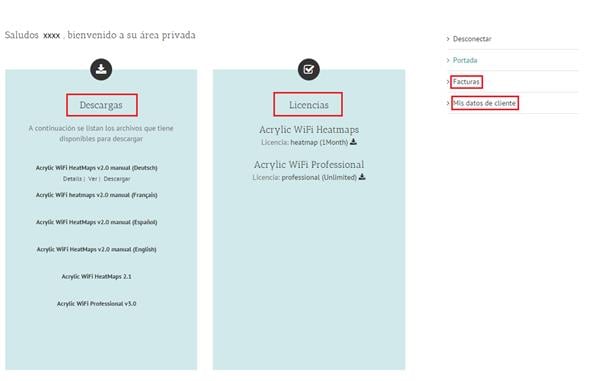
To get your software install licensed, you can download your license code from our client area, or copy it from your confirmation email.
2.3.3. Getting your Acrylic Wi-Fi Heatmaps Install Licensed
During the evaluation period, you can get your Acrylic Wi-Fi Heatmaps install licensed from to the "License/Registration" option in the main menu. Once you have entered your license code, it is recommended to restart Acrylic Wi-Fi Heatmaps for the license change to take effect.
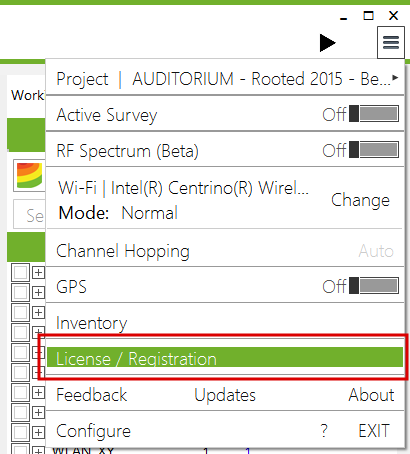
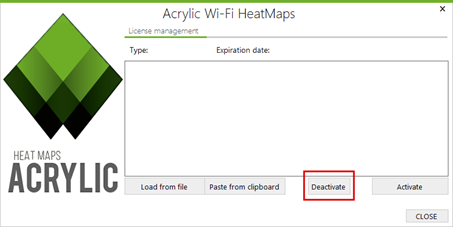
From the License window you can:
● View license type and expiration date.
● Activate or deactivate your license.
● Paste or read the license code from the license file.
You will be shown a blue confirmation message once the licensing process has been successfully completed.
On the other hand, if the licensing process could not be completed, you will be shown a red failure message indicating the reason why your install could not be licensed, and how to proceed from there on.
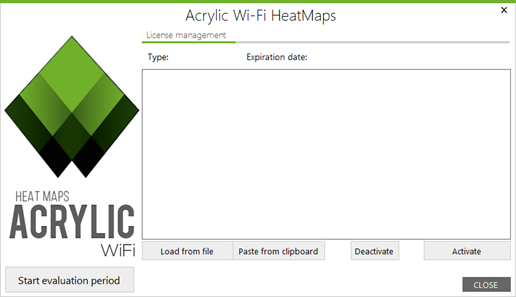
NOTE: Acrylic Wi-Fi Heatmaps needs to be connected to the Internet in order to validate your license code.
3. Creating a Site Survey Project
Introduction
Acrylic Wi-Fi Heatmaps main work unit, where all site survey information is stored, is the Project. To start any wireless network analysis task, it is necessary to create a site survey project, or open an existing one to continue analyzing.
Detailed information on how to create a new site survey project for analyzing a Wi-Fi infrastructure and detect possible improvement areas is shown bellow.
Note that a site survey study can be performed periodically in order to analyze the changes in the radioelectric space affecting the wireless network performance.
3.1. Project Structure
Acrylic Wi-Fi Heatmaps projects are sorted by hierarchy for them to adjust to all types of
site survey studies, from single to multiple location projects, covering
indoors and outdoors areas, as well as geographically separate locations.
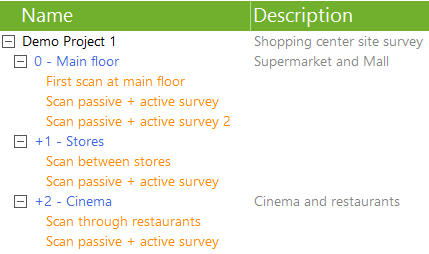
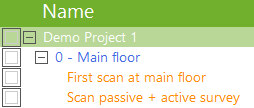
3.1.1. Locations
A project is structured by locations. Each location represents a place, area or venue where the site survey is performed. Acrylic Wi-Fi Heatmaps allows you to sort these locations into sublocations, if necessary.
A location can be associated with a blueprint of the area to be covered by the site survey. This is optional and not required to perform the measurements.
Here are two simple examples on how to use and define locations:
1. Example 1: Site Survey on a 3-story Building

For this project, 3 locations will be defined, one per story. A name and description can be assigned to each location.
Once the locations have been created, in order to perform the site surveys on each one of them, the current location should be first selected.
Here we have 3 stories. Results and reports will be arranged accordingly.
2. Example 2: Site Survey at a 2-campus University
This is a site survey project for a university with two campuses, a northern campus and a southern campus, where each campus has a 3-story building.

In this case, two main locations are generated, one for the northern campus, and another one for the southern campus. Within each campus location, more locations will be added to each building.
Depending on the surveyed building characteristics, it is possible to follow the approach described in the previous example and add a new location at each floor for every building, along with additional locations such as parking lots, parks, etc.
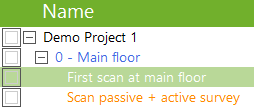
3.1.2. Scans
During a site survey, you can perform one or more data captures or scans. Within each location, it is possible to perform all the required measurements necessary to cover all the area to be analyzed.
The fact of being able to perform several measurements in one location allows you to:
● Perform measurements in different times during the day or week to compare Wi-Fi activity levels. Measurements can be compared by using Layers from the Plot generation view that is shown later in this manual.
● Compare under different conditions:
○ One measurement on Native Capture Mode, and another one on Monitor Mode.
○ One measurement on Passive Mode, and another one on Active Mode.
3.2. Creating a New Project
There are two ways to create a new site survey project in Acrylic Wi-Fi Heatmaps:
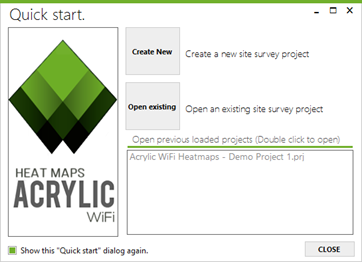
Through the Quick Start window that is shown by default when Acrylic Wi-Fi Heatmaps is started. From this window you can access to the most recently projects, open an existing project, or create a new one.
● Through the Project → New option in the main menu. For this option to be enabled there should be no opened projects. Projects can be close by selecting the option Project → Close in the main menu.
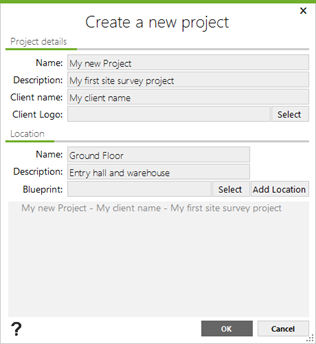
During the project creation process, you are required to enter the project’s name and description, as well as client’s information, including its corporate logo to be included in the final reports.
You are required to specify at least one location, to which a building blueprint or area map will be associated. This blueprint or satellite map is required to perform the measurements.
If a blueprint is included, it should be previously calibrated or geopositioned. Please, refer to the Calibration section for more details on this process.
By default, locations represent a project’s main surveyed areas. If you want to make a certain location dependent on another location, before adding the new dependent location, you will need to select the controlling or master location from the list of added locations.
You can repeat this process until you have created the necessary site survey structure.
3.3. Blueprint Calibration
Once you have selected a blueprint matching your location, you will need to calibrate it, meaning that you will need to assign physical units to the image to determine its actual size.
Acrylic Wi-Fi Heatmaps offers two different blueprint calibration mechanisms. Assisted calibration, where the blueprint is positioned, rotated and escalated over a satellite image visualization system until matching its physical location; and manual calibration, where the actual distance between two points on the blueprint is indicated to establish the blueprint’s scale.
3.3.1. Assisted Calibration
To calibrate a blueprint using this method, you first need to know the actual absolute location of the building or structure represented in the blueprint.
It is recommended to use blueprints with transparent backgrounds (PNG files, etc.) that only display relevant areas. This makes the calibration easier and the final report results will look more visually appealing.
NOTE: If you calibrate a blueprint using this method, you will be able to see both the blueprint and the satellite map views in Acrylic Wi-Fi Heatmaps. Measurements performed on the blueprint on any of the two views will be georeferenced with latitude and longitude data, therefore, the generated graphics can be saved as KMZ format files that can be opened in GIS tools such Google Earth or similar applications.
Use this method whenever possible. Blueprint calibration steps are shown below:
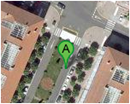
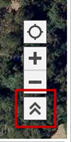
1. Locate the buildings and structures in the blueprint. Navigate the map using the zoom slider as required. If you need help in finding the location, you can use the location browser.
|
|
|
2. The desired location is then shown on the map that can be rotated and scaled to adjust to the actual building. Opacity can be also adjusted to modify the blueprint transparency to make sure it overlays on the right position.
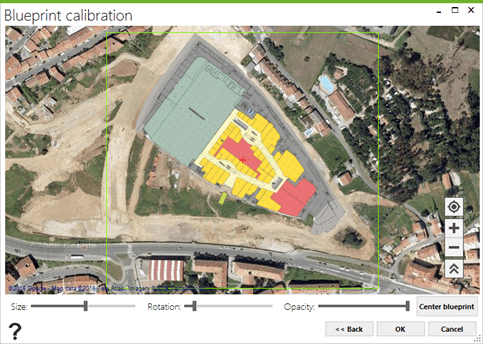
The blueprint can be calibrated again at any given time if necessary.
3.3.2. Manual Calibration
Manual calibration helps establishing blueprint dimensions but not blueprint absolute positioning. In other words, the blueprint dimensions are obtained, but not its actual geographical position, so latitude and longitude coordinates are not provided.
This calibration method is recommended when latitude and longitude coordinates for the blueprint elements are unknown, or when determining the blueprint absolute position would be too complicated.
NOTE: If a blueprint is calibrated using this method, the blueprint view will not be available. The use of a GPS device will not be allowed, and KMZ format reports will not be available. For information on this report, please refer to the reports help section.
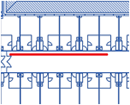
Blueprint manual calibration steps are shown below:
1. Identify in the blueprint an area where the distance between two points is known.
2. Select the first point.
3. Select the second point.
4. Indicate the distance between the two points and the length unit.
The use of blueprints is most suitable for indoor areas, where the area’s position cannot be easily established from a satellite map.
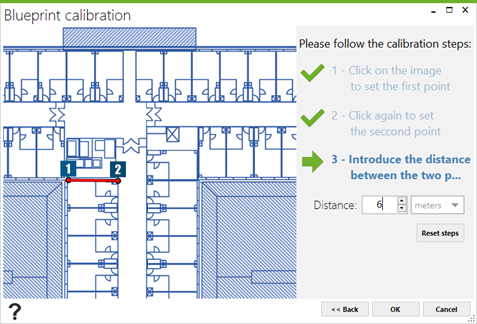
3.4. Project Editing
A project can be edited with the purpose of adding, modifying, and deleting the elements it contains.
NOTE: Changes made to a project cannot be reverted, so if you are unsure about the changes or for security reasons, you should make a backup copy of your project before applying any changes. To open your projects, go to Project → Projects folder.
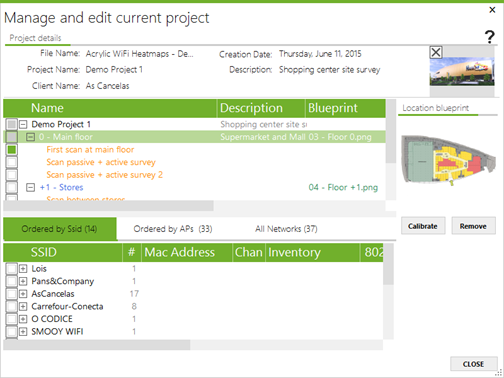
You can add new locations, modify project information, such as the project’s name and description, client’s name, as well as add blueprints to locations.
|
|
|
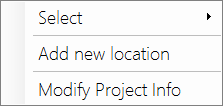
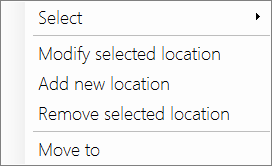
You can modify location parameters, add a new daughter location, delete it from the project, or move it as a daughter location to another location.
|
|
|
NOTE: If a location is deleted, all dependent locations and measurements will also be deleted.
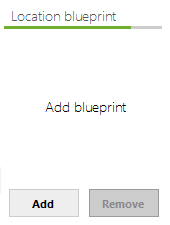
Adding a Blueprint to a Location
After selecting the location to which the blueprint will be added, click on the Add button. Once the blueprint has been associated with the intended location, you will need to calibrate it to start performing measurements.
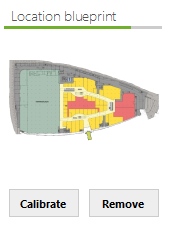
If a location has been scanned, Acrylic Wi-Fi Heatmaps will not allow you to delete the associated blueprint until the measurements have been previously deleted or moved to another location.
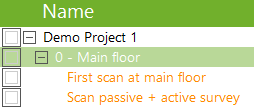
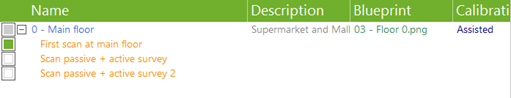
You can modify, delete or move the performed scans to a different location.
|
|
|
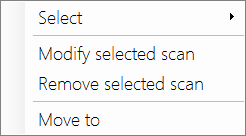
NOTE: If any of the measurements is moved to a different location, make sure the target location has the same blueprint associated with it, or otherwise there might be some inconsistencies.
On the bottom view, once one or more scans are selected, you will see the access points detected during the site survey.
From the bottom view, you can inventory the project’s access points or delete those that are no longer needed.
NOTE: Once an element is deleted, it can no longer be recovered.
4. Performing a site survey and viewing the results
Introduction
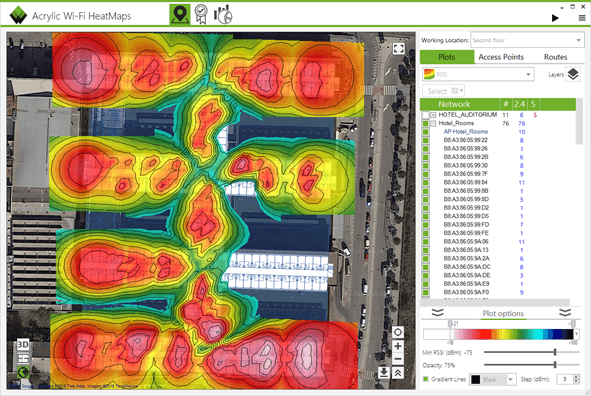
Site Survey is the default view mode when starting Acrylic Wi-Fi Heatmaps. This view mode has double functionality: it allows monitoring your site survey and, once the data has been collected, it allows you to visualize the results.
4.1. Survey Section General View
To perform and visualize the measurements, different view modes are available.
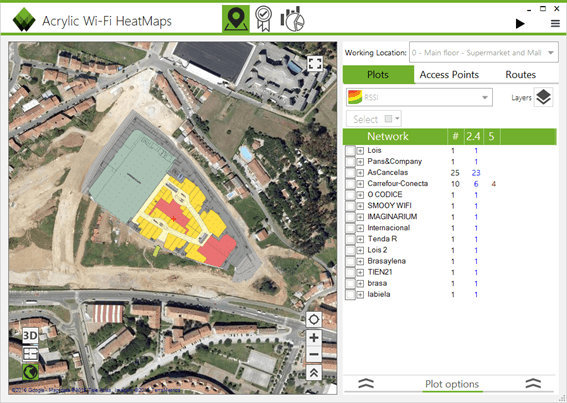
Work Location indicates the location on which you are currently working, to either display the results with graphics (plots) or to perform a new scan.
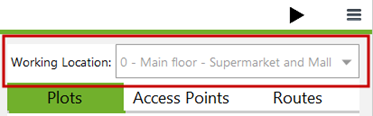
The Working Location scroll-down menu lists all the locations associated with the current project, and you will be able to select and start working on any one of them. By selecting a listed location you can either perform site surveys or visualize the results.
Acrylic Wi-Fi Heatmaps allows you to work directly on the blueprint of the surveyed building or area, as well as on a satellite map, which is particularly useful when a blueprint is not available or when you want to perform measurements out of the blueprint area, or even with GPS data readings over a satellite map.
For those locations with a geopositioned associated blueprint, this will be displayed overlaying the satellite image.
The Blueprint and Satellite view modes can be selected during a scan or to display the results.
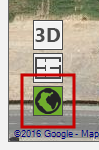
To visualize the results, three view modes are available:
· Blueprint View
· Satellite View
· 3D View
4.1.1. Blueprint View
The Blueprint view displays the blueprint associated with the currently selected location. This view mode will be available for locations with associated blueprints. You will be able to zoom in and out and move along the blueprint for a more detailed view.
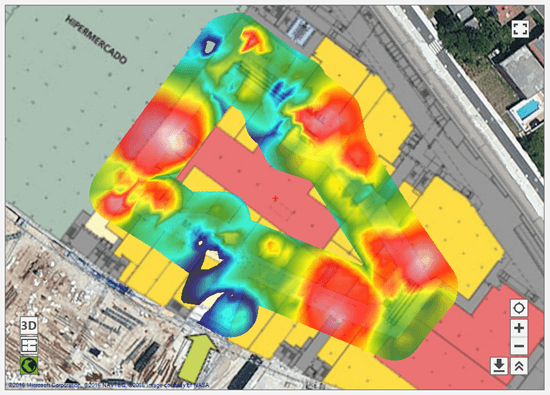
4.1.2. Satellite View
The Satellite View displays a satellite image of the Earth. In case the associated blueprint has been geopositioned, this will be displayed overlaying the satellite map.
This view mode will be available for all the locations with no associated blueprint, and for those locations with an associated blueprint that has not been calibrated on Manual Mode, which means that the blueprint has not yet been geopositioned.
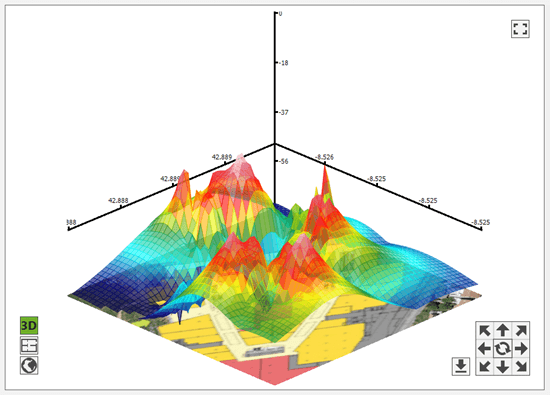
4.1.3. 3D View
The 3D View displays the graphics rendered in a three-dimensional representation to improve visualization through elevation curves of the represented parameter values.
This view is available during the data visualization, and measurements cannot be performed on this view mode.
4.2. Scanning
During a Wi-Fi site survey, measurements are performed on a desired area for the selected location’s wireless infrastructure to be later analyzed and evaluated.
A Wi-Fi site survey is performed by moving along, and capturing data from, the selected location. During the process, measurement points are established, either manually or automatically, to which the collected data is associated with.
For a correct site survey, it is recommended to review the configuration of all the elements involved.
1) Wi-Fi Device:
a) Normal Mode.
b) Monitor Mode.
2) Site Survey Type:
a) Passive (default).
b) Active.
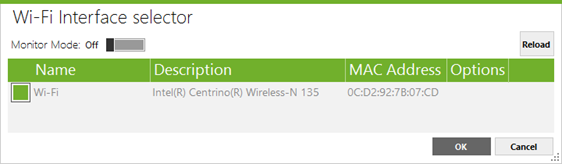
4.2.1. Selecting the Wi-Fi Device
Before starting a site survey, you need to specify the Wi-Fi interface that will be used to perform the measurements.
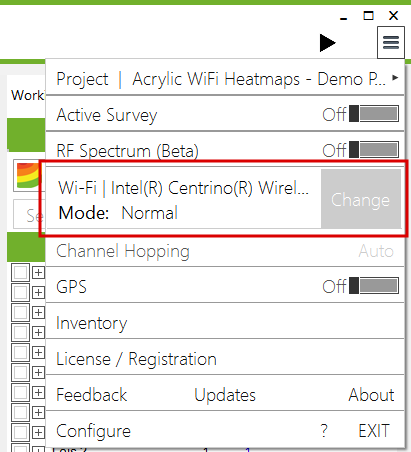
When selecting the Modify Wireless Network option, you will see a list of all the interfaces available in the system.
In Acrylic Wi-Fi Heatmaps you can use two different types of Wi-Fi devices, depending on their capturing capabilities. All commercially available Wi-Fi devices can be used to capture data on Native Mode. For extended capture capabilities, you will need a compatible wireless card to be used on Monitor Mode.
4.2.1.1. Native Capture Mode
When monitoring on Native Capture Mode, the wireless card acts as any standard Wi-Fi device, using Windows native mechanisms, capturing only a specific type of Management packets, Beacon to be specific, which are the ones originated by the access points.
These packets are transmitted several times per second by the access points to indicate which network or networks are currently broadcasting. Acrylic Wi-Fi Heatmaps captures, analyzes, and reads these packets and associated data, displaying the contained information to later save it to the current project.
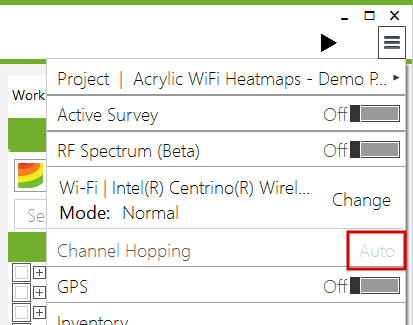
This would be the recommended capture mode to perform site surveys.
Operating on this mode, the channels and frequency bands used during the site survey measurements are managed by the operating system, and cannot be configured. Therefore, the Channel Hopping option is disabled and it will be shown on Auto Mode. For more information on Channel Hopping, refer to the related section in this guide.
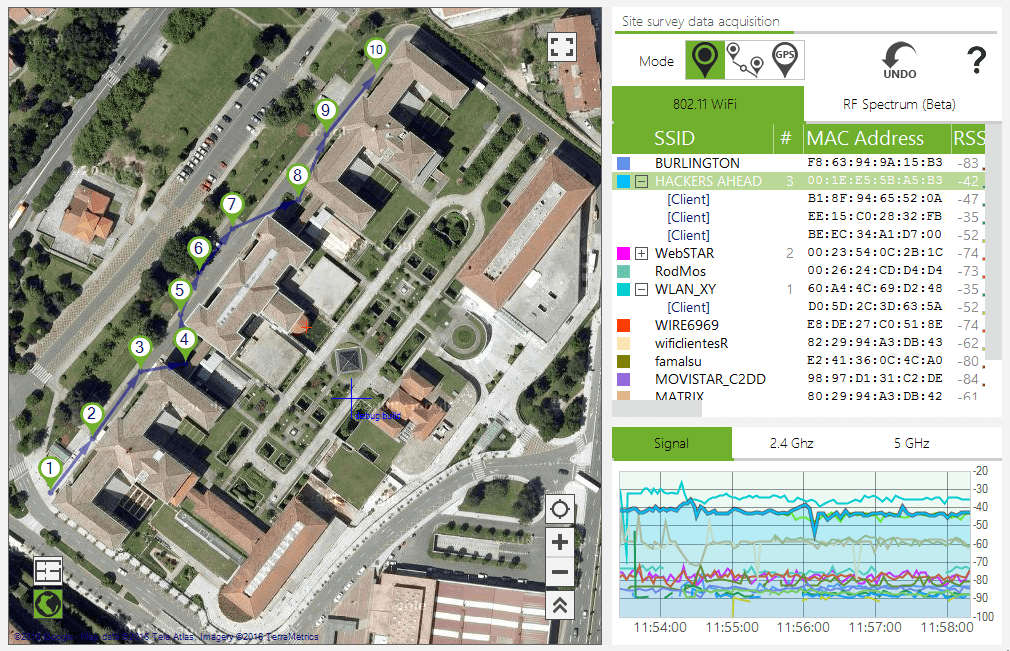
4.2.1.2. Monitor Mode
The Monitor Mode in Acrylic Wi-Fi Heatmaps allows the use of a wireless network card on Promiscuous Mode. Operating on this mode, the wireless network card is able to capture all types of Wi-Fi packets, including Management, Data, and Control packets.
This way, it is possible to detect not only the access points, but also the client devices that are transmitting on the Wi-Fi frequency bands, as well as all the devices that are connected to the access points.
To operate on Monitor Mode, an Airpcap card or NDIS compatible card is required. For more information, refer to Compatible Cards section. To operate on Capture Mode, NDIS driver should be installed.
Operating on this mode, the channels and frequency bands used during the site survey measurements can be configured, and the Channel Hopping option will be shown on Manual Mode.
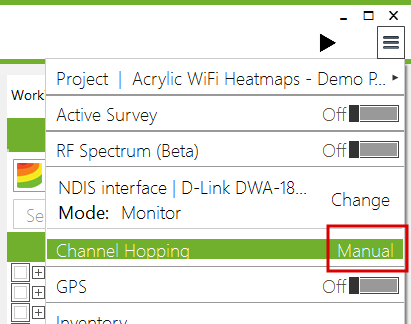
NOTE: On Monitor Mode, the 2.4Ghz band is used by default. The number of supported channels will depend on the wireless card used. For more information, refer to your wireless card’s manufacturer specifications.
4.2.1.2.1. NDIS Driver Installation
The NDIS driver should be previously installed to operate on Monitor Mode with NDIS compatible cards.
NOTE: You will need a wireless card that supports Monitor Mode. Refer to the section on compatible Wi-Fi devices.
When activating the Monitor Mode, from the Wi-Fi device selector, click on the installation button to install the NDIS driver in case it has not been previously installed.
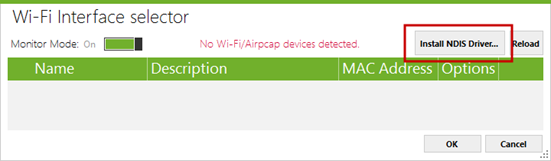
The next window warns that installing the NDIS driver may cause system failure. At this point the driver installation can still be canceled:

If the driver has been successfully installed, the following message will appear:

If during the installation of the additional modules the warning “Unable to copy Airpcap.dll” is displayed, then the library could be used by another process. Close any packet analyzer or software that may be using this library.
4.2.1.2.2. Channel Hopping
Wi-Fi devices can transmit on two different frequency bands, 2.4GHz and 5GHz. These bands are divided into different channels, so that each channel covers a frequency range within the band.
A Wi-Fi device transmits on a certain channel within said frequency bands. For some devices, this default channel can be configured.
Acrylic Wi-Fi Heatmaps scans these frequency bands, going from one channel to another for short periods of time. This is called Channel Hopping. Using this technique on Monitor Mode, it is possible to detect all the network’s access points, along with other devices, transmitting on any of the scanned frequencies.
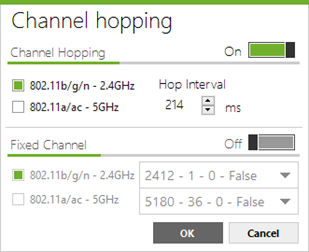
Channel Hopping configuration allows scanning separately the 2.4GHz and 5GHz frequency bands, or both bands at the same time. Acrylic Wi-Fi Heatmaps also allows Fixed Channel scans, detecting only those devices transmitting on the selected channel.
NOTE: By default, Channel Hopping is carried out on the 2.4GHz frequency band. This means that, by default, the 2.4GHz band channels are scanned. If you want to also scan the 5GHz frequency band, or the 5GHz band alone, you should check the configuration after selecting the Wi-Fi device.
4.2.2. Types of Network Surveys
Scans performed using Acrylic Wi-Fi Heatmaps are classified in two groups, Passive Surveys, where the card only “listens” to the Wi-Fi data transmitted through the air and saves the measurements data; and the Active Surveys, where the Wi-Fi device interacts with the wireless medium to obtain network performance values.
4.2.2.1. Passive Survey
This type of survey is performed by default. During the type of analysis, no Wi-Fi packets are transmitted and the card can be operating either on Normal Mode or Monitor Mode.
4.2.2.2. Active Survey
If you have a second wireless card installed in your system, you can use this device to perform an Active Survey.
During an Active Survey, the system is connected to a Wi-Fi network, interacting with the wireless medium, and performing network performance measurements.
During an Active Survey, data packets are sent and received to obtain actual latency, bandwidth, packet loss rate, and roaming measurements. Therefore, this type of survey is appropriate to measure user experience standards.
Requirements to perform an Active Survey:
● Two wireless network cards. One of them will be set on passive capture mode, and the other one will be set on active capture mode.
● The wireless card selected on the menu will be always used for the passive capture, so it should not be connected to any network. It will only be used to perform measurements without interacting with the wireless medium.
● The second wireless card will should be connected to the network to be analyzed.
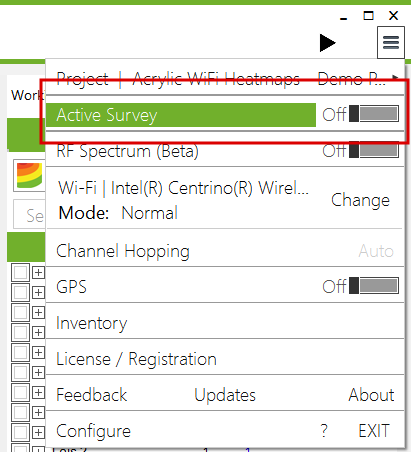
● The Active Survey configuration options (Menu → Configuration → Active Survey) should be correctly configured.
● The active capture selector in the menu should be enabled.
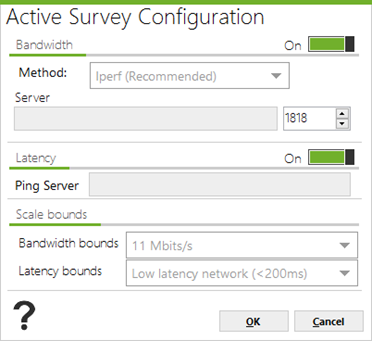
Active Survey configuration options are shown below:
|
Option |
Description |
|
Bandwidth |
This option is configured if bandwidth measurements will be performed. In case this option is activated, the user will have to choose the preferred measuring method. There are two options to choose from: Iperf: Free software that only performs bandwidth and latency measurements. This software can be found in the Acrylic Wi-Fi Heatmaps installation software. To use this method, Iperf should be running on a corporate local network server that can be accessed through a Wi-Fi connection. The run the software on server mode, use the following command: ‘iperf -s -p <port>’. Once the site survey is initiated, Acrylic Wi-Fi Heatmaps will connect to this service and will perform the bandwidth measurements. It is important to have the server connected to a network with no delays and fluctuations that could negatively impact the measurements. NOTE: Iperf is the recommended option to perform these measurements. File Download: A files is downloaded using a standard protocol such as HTTP or FTP. This method is not recommended, since it would produce less accurate results that the first one. Acrylic Wi-Fi Heatmaps will use this file download to perform the measurements. Once the download is finished, the software will restart automatically. For the download, it is recommended to use a large size file of at least 500MB. To configure this option, you need to specify a valid URL, such as: http://www.software.com/big_file.dat or ftp://ftp.software.com/pub/file |
|
Latency |
When latency measurement is enabled, the user should configure a host that responds to ICMP requests (PING). Normally, the Wi-Fi connection gateway IP address (to which the second wireless card used in the Active Survey will be connected) is used. |
|
Scale |
These options are exclusively used for representing the Active Survey results and generating the site survey reports. Since bandwidth and latency data can have wide data ranges, these parameters can be easily adjusted to the data obtained from the site survey. |
4.2.3. Starting a Site Survey

Once the site survey options and modes have been configured, click on the Start button to initiate the site survey. You can pause or completely stop a site survey while it is running.
If during a site survey scan the Pause button is clicked, Acrylic Wi-Fi Heatmaps will stop performing any measurements until the scan is resumed. Once the site survey is resumed, Acrylic Wi-Fi Heatmaps will continue capturing data.

If during a site survey scan the Stop button is clicked, Acrylic Wi-Fi Heatmaps will stop capturing data completely for that scan. If the Start button is clicked again, a new data capture will be initiated and the collected data will be saved to a new scan.
Clicking the Stop button while a site survey is paused will have the same effect as if it were clicked while the site survey is running.
4.2.4. Performing Measurements
During a scan, Acrylic Wi-Fi Heatmaps captures the data from the wireless medium, and it is necessary to establish exactly where the data has been collected. Therefore, there are three different methods to identify the Acrylic Wi-Fi Heatmaps current position in order to georeference the measurements.
Scan Modes:
1. Single Measurement: Useful for small measurements or to cover areas with no measurements.
2. Continuous: Used to cover large indoor or outdoor areas with minimum effort.
3. GPS: A GPS device is used to geoposition the measurements. Useful for outdoor scans.
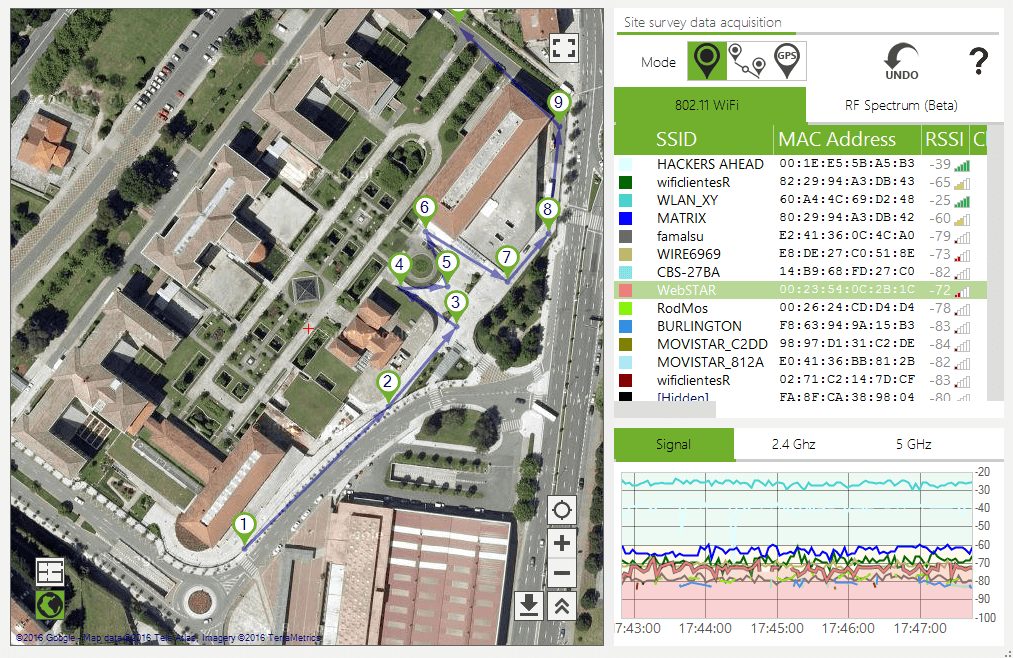
4.2.4.1. Single Measurement Mode
![]()
On this mode, our current position should be indicated over the blueprint or satellite map view for Acrylic Wi-Fi Heatmaps to perform a spot single measurement, and the collected data is then associated with the indicated position.
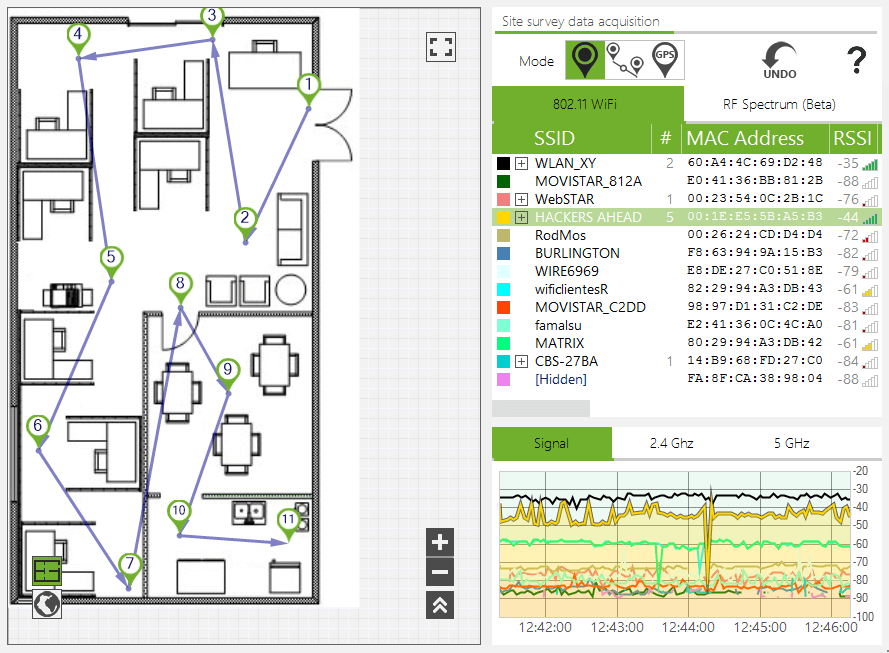
This is the default measurement mode for new scans. The application will identify each measurement spot with sequential numbering. These points are joint by arrow lines, so that the site survey path can be easily visualized.
Recommended for: Small or spot measurements, or to perform measurements in areas that have been left uncovered after a site survey performed on Continuous/GPS mode.
NOTE: If a site survey scan on Continuous Mode is paused,![]() Acrylic Wi-Fi Heatmaps resumes the scan on single measurement mode
Acrylic Wi-Fi Heatmaps resumes the scan on single measurement mode![]() , so it is necessary to reselect Continuous Mode to continue with the current scan.
, so it is necessary to reselect Continuous Mode to continue with the current scan.
4.2.4.2. Continuous Mode
![]()
This is the recommended capture mode, since the number of interactions with Acrylic Wi-Fi Heatmaps is limited to the minimum, speeding up and simplifying the site survey process. Operating on this mode, the user only has to indicate the starting and ending points, while Acrylic Wi-Fi Heatmaps automatically captures the data and positions the intermediate measurements.
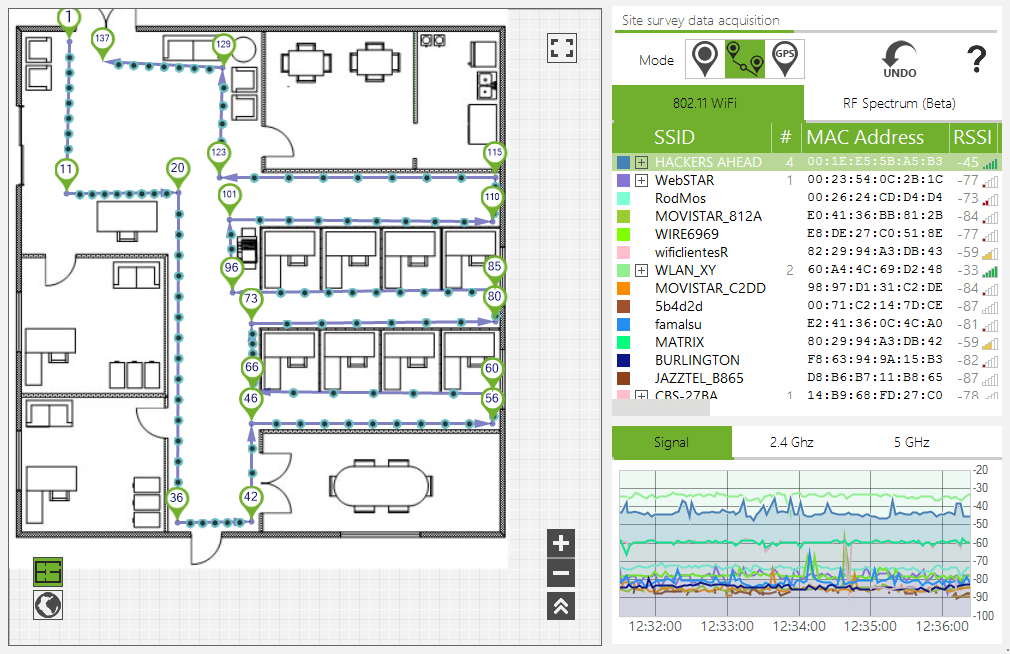
On the blueprint or satellite map, select your current as starting point and start walking straight at a constant pace until you have to change direction or you have reached your destination. From then on, you have to start this procedure all over again with a new location. Acrylic Wi-Fi Heatmaps saves all the measurements performed during the scan.
The intermediate measurement points scanned during this process are identified with a point icon (![]() ).
).
Acrylic Wi-Fi Heatmaps performs measurements along the way, helping reduce time and effort at the time of covering large areas during a site survey.
Recommended for: Large outdoor and indoor areas when a GPS device is not available or GPS precision is not sufficiently accurate.
Example: Performing a site survey in a squared room. Position yourself at the room’s entrance door, select your position on the blueprint and start walking straight at a steady pace until you reach one of the corners. Once you reach the corner, select the new point on the blueprint, and continue walking to the next corner. You do not need to stop walking to mark the point on the blueprint.
Repeat the procedure until you reach the room’s door.
This way, we can quickly perform a site survey on a large area, covering the perimeter of a rectangular room with just 4 clicks, no matter what size the room is.
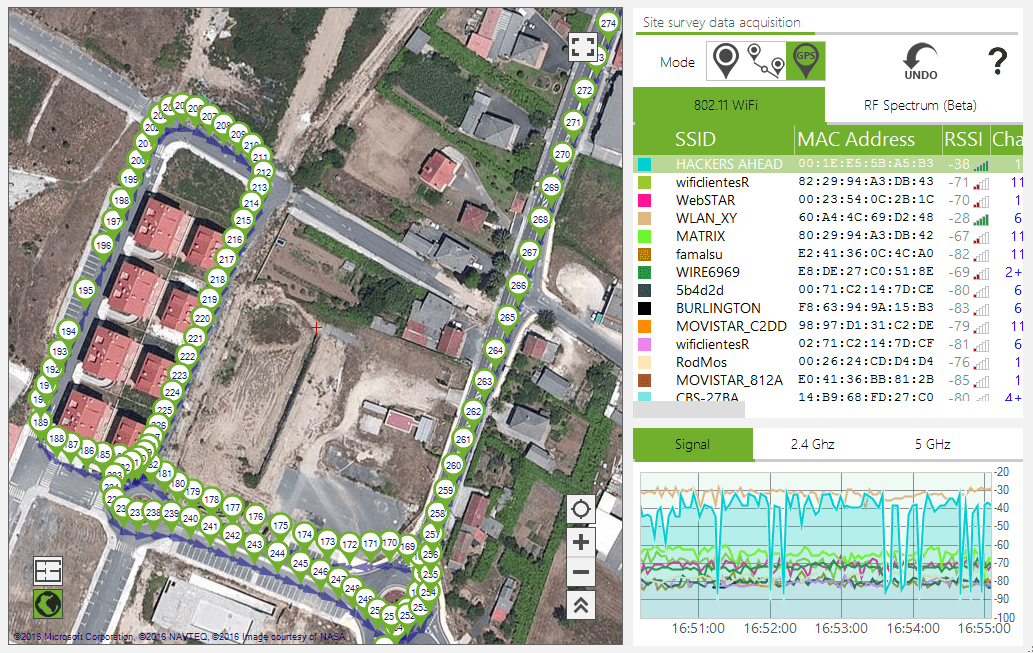
4.2.4.3. Real-time GPS Mode
![]()
During a GPS enabled scan, measurement points are automatically generated as the latitude and longitude coordinates are fed, and Acrylic Wi-Fi Heatmaps performs the measurements along the way with no interaction required, to then associate the measurements with their corresponding GPS coordinates.
This is an automatic mode. Once a site survey is started, Acrylic Wi-Fi Heatmaps captures the GPS positions and georeferences all the networks’ measurements.
If your GPS device is not yet configured, a pop-up window will prompt you to configure it and start it.
For more information, please refer to the help section on GPS support.
Recommended for: Large and outdoor area measurements. It can be conveniently used from a moving vehicle at a slow constant pace to ensure a consistent data capture.
4.2.4.4. Undoing Measurements
During a site survey, you have the option to delete or “undo” the most recent real-time measurements by clicking on the Undo button (![]() ). This way, you do not need to delete or edit the measurements once the site survey is completed.
). This way, you do not need to delete or edit the measurements once the site survey is completed.
Note: If you “undo” a measurement on Continuous Mode, the last measured point is deleted, along with the previously computed points, and the site survey will automatically switch to Single Measurement Mode. To continue the site survey on Continuous Mode, you need to reselect this mode. The reason behind this is that you are required to indicate your current position once again, since after deleting or “undoing” your most recent measurements, this data is permanently lost.
4.2.5. Support Instrumentation During a Site Survey
During a site survey, you are able to see detected device information, as well as graphics based on the collected data and collected data general status so you can verify the measurements are being performed correctly.
The displayed information is shown below:
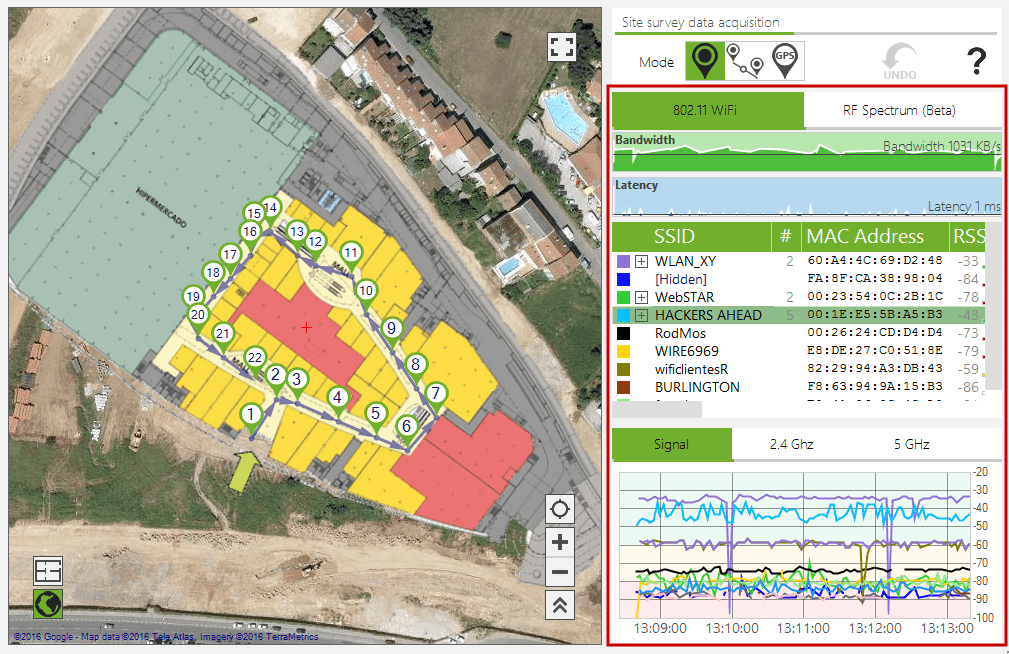
4.2.5.1. Bandwidth
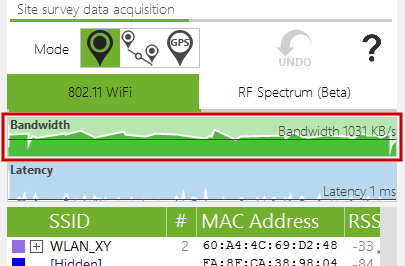
This graphic shows the evolution of the connection’s bandwidth during a site survey.
This graphic is only visible for a site survey on Active Mode if the Bandwidth option is enabled.
4.2.5.2. Latency
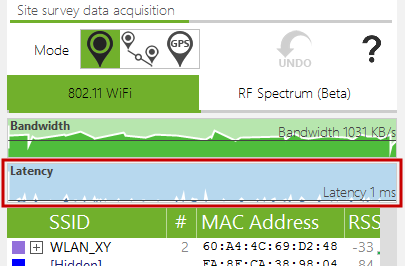
This graphic shows the evolution of the network’s latency during a site survey.
This graphic is only visible for a site survey on Active Mode if the Latency option is enabled.
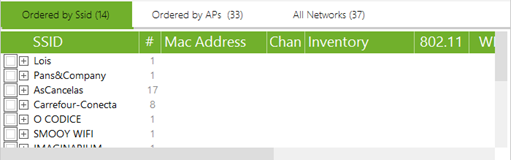
4.2.5.3. Access Points
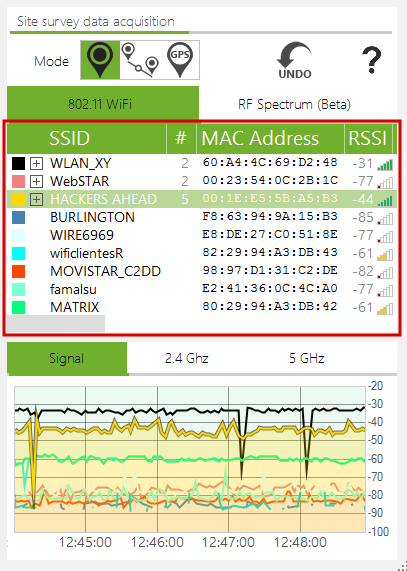
Acrylic Wi-Fi Heatmaps allows visualizing all detected access points in real time. For a site survey on Monitor Mode, the number of clients connected to those access points is also shown.
Each device is listed in row, including device information under each column, such as Signal Strength, Signal-to-Noise Ratio, MAC Address, security options, etc. This window is really useful to know the status of all Wi-Fi devices at a glance.
|
Column |
Information Provided |
|
SSID |
Stands for: Service Set Identifier. In other words, the network’s name. A network can hide its name. In such a case, the network’s name is shown as [Hidden]. This field can be configured from the Preferences window that appears by clicking on the Configure option in the main menu. However, even when a network is not broadcasting its name, in some cases, the network name can be obtained on Monitor Mode by inspecting and analyzing the Wi-Fi traffic of the devices that are connected to that network. Whenever possible, Acrylic will display this name in red, which means that this is a hidden network and the name has been inferred by the software. |
|
# |
This column displays the number of devices connected |
|
Mac Address |
(Media Access Control Address) Unique identifier assigned to network interfaces used as a network address. This field can display a name instead of the 6-bytes address when the MAC address is previously inventoried. |
|
RSSI |
A Received Signal Strength Indication is a dBm value that indicates the wireless signal strength received by the client, and it usually ranges from 0 to -100. The higher the value, the stronger the signal. |
|
SNR |
Signal-to-Noise Ratio measured in dB that is used to compare the signal received with the background noise. The higher the value, the better the communication quality. This field is only available when the site survey is performed using an AirPcap device. |
|
Chan |
Network operating channel. It can be shown as an addition of two numbers (such as: ‘1+5’), indicating that the network is operating on both channels (primary and secondary). |
|
Width |
Channel bandwidth measured in Mhz. Possible values are 20, 40, 80 and 160. |
|
802.11 |
These are the communication standards that are supported by the network’s access points. Possible values are: a, b, g, n and ac. |
|
Max Rate |
Maximum transfer ratesupported by a network access point measured in Mb/s. |
|
Retries |
Percentage of packets that had to be resent due to a transmission error. The total number of resent packets is shown between brackets. |
|
WEP |
Type of WEP security of the access point. If empty, this means that the network does not support WEP security. Possible values are SharedKey and Open. |
|
WPA |
Access point WPA security type. If empty, this means that WPA security is not supported by the network. Possible values are PSK and MGT. |
|
WPA2 |
Access point WPA2 security type. If empty, this means that WPA2 security is not supported by the network. Possible values are PSK and MGT. |
|
WPS |
WPS version supported by the access point. If empty, this means that WPS security is not supported by the network. If WPS Authentication is enabled, it is displayed in green. If not, it is displayed in red. |
|
Vendor |
The manufacturer brand name of the network interface being used by the Wi-Fi device. |
|
Data |
Amount of Data packets sent by the Wi-Fi device. |
|
Mgt |
Amount of Management packets sent by the Wi-Fi device. |
|
First |
Time at which a device has been first detected. |
|
Last |
Time at which a device has been last detected. |
|
Type |
Network type. Possible values are Infrastructure and Ad Hoc. This field only applies to access points. |
|
Latitude |
For a GPS enabled site survey, this value corresponds to the latitude of the position where the device was last detected. |
|
Longitude |
For a GPS enabled site survey, this value corresponds to the longitude of the position where the device was last detected. |
4.2.5.4. Signal Strength
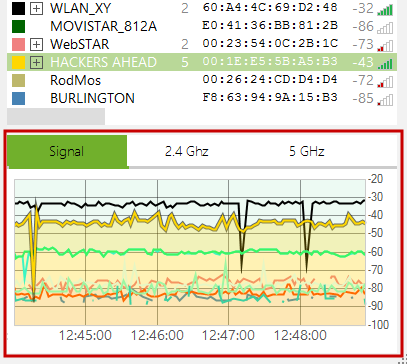
This graphic represents signal strength in real time for each network’s access point that is detected during the site survey. Values evolve during the scan according to the signal strength changes for each access point.
The line color matches the access point color, shown at the top of the screen.
4.2.5.5. Access Points by Channel on 2.4GHz
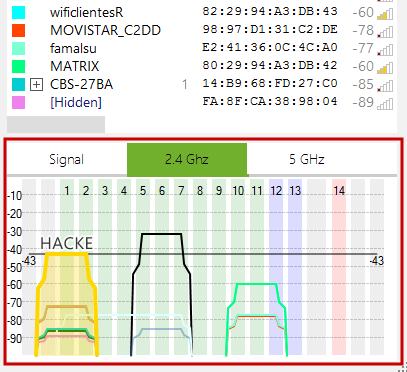
This graphic shows signal strength for each access point by channel in the 2.4GHz frequency bandwidth.
The line color matches the access point color, shown at the top of the screen.
4.2.5.6. Access Points by Channel on 5GHz
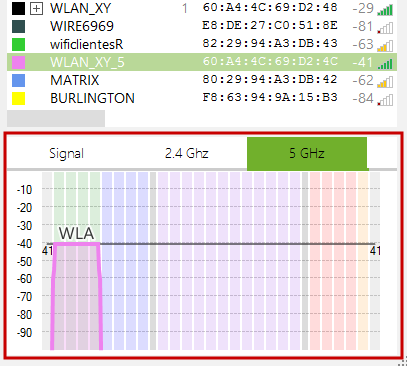
This graphic shows signal strength for each access point by channel in the 5GHz frequency bandwidth.
The line color matches the access point color, shown at the top of the screen.
4.3. Site Survey Results Analysis
Once one or more scans have been performed at a site survey project’s location, you will be able to visualize the parameters analyzed during the data capture process.
There are three tabs from where to visualize the information collected during the site survey.
● Graphics: In this section, you can select and generate the different graphics and heatmaps available for each access point identified during the site surveys.
● Access Points: This section displays the location of all access points identified during the site surveys.
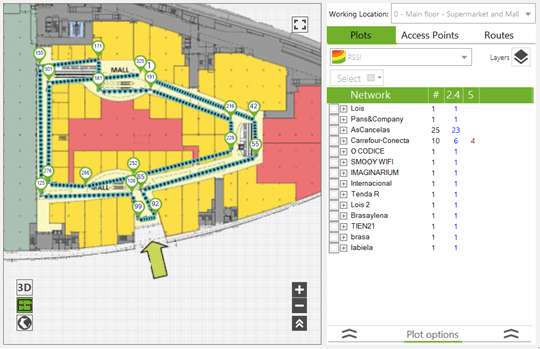
● Scans: This section displays the paths followed during the site survey scans.
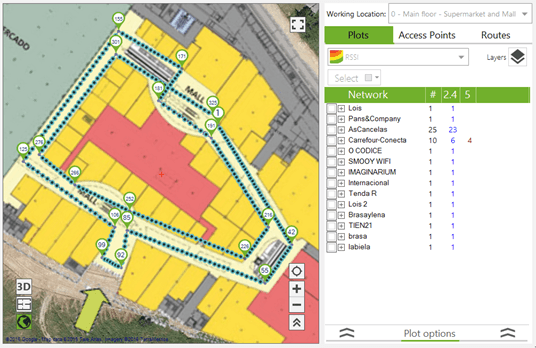
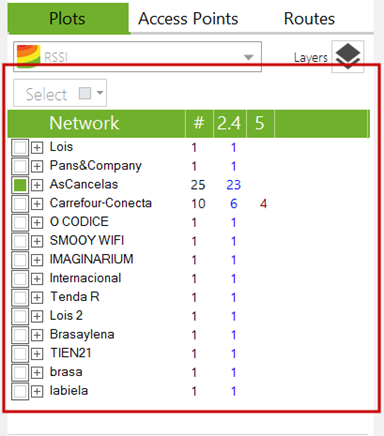
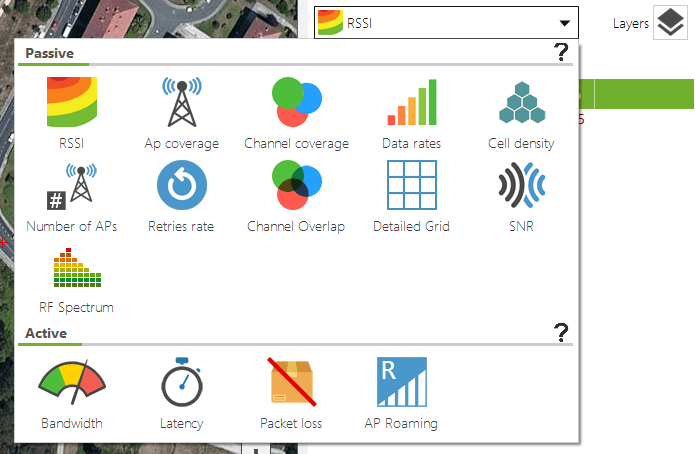
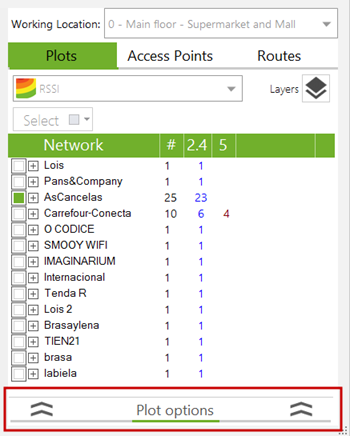
4.3.1. Plots
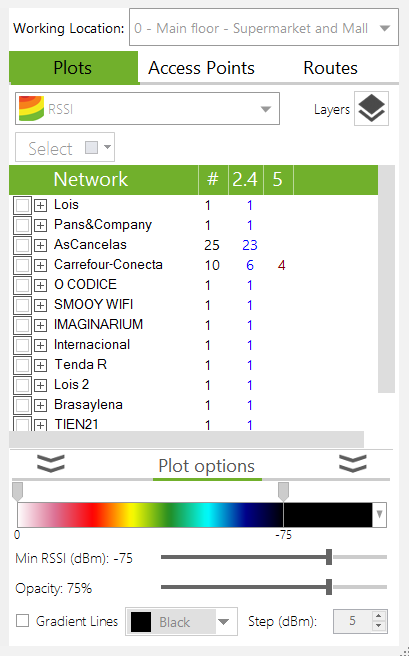
This tab shows the data collected during the scans as a graphic for the selected surveyed location. With this data, you can generate many different plots that allow you to visualize the current status of the Wi-Fi network in the selected surveyed location.
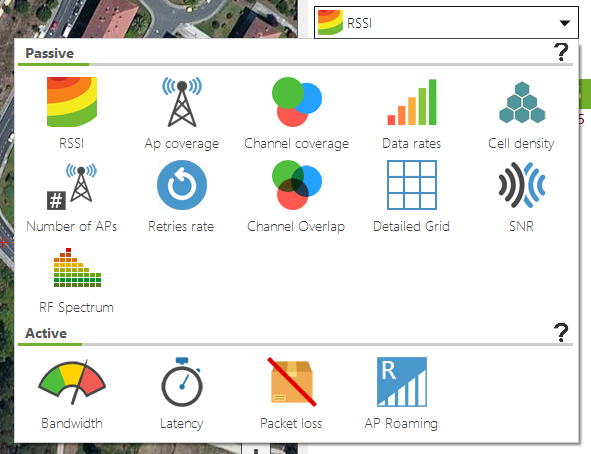
Acrylic Wi-Fi Heatmaps displays the collected data through 14 different types of plots. Each one of these plots represents different aspects of the surveyed wireless signals to quickly analyze and display the actual network status and identify improvement areas.
These plots are grouped by site survey mode.
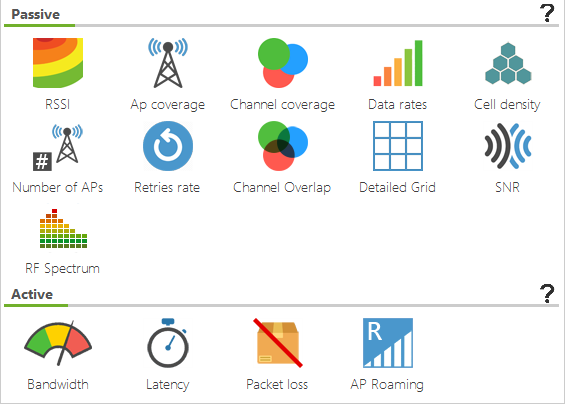
4.3.1.1. Passive Capture Plots
Plots that can be generated after performing a site survey on Passive Mode are shown below.
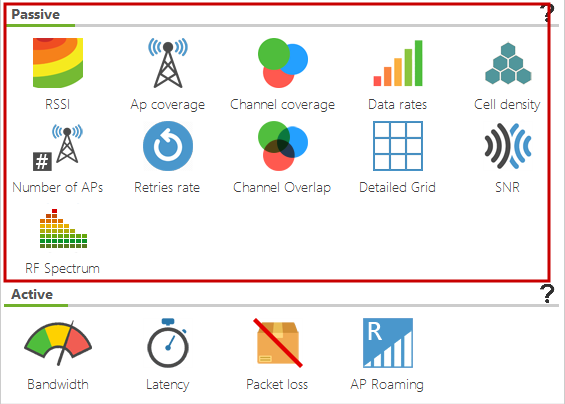
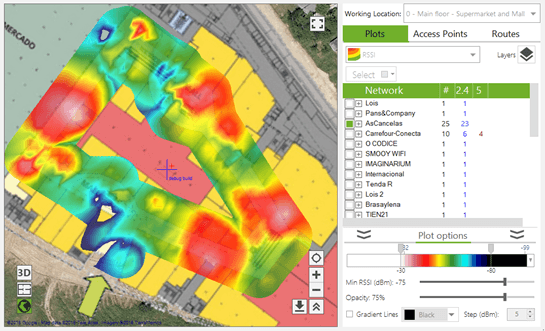
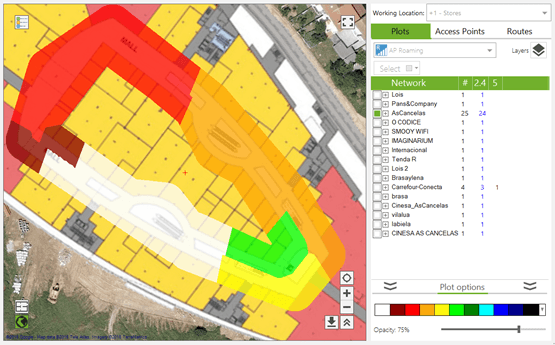
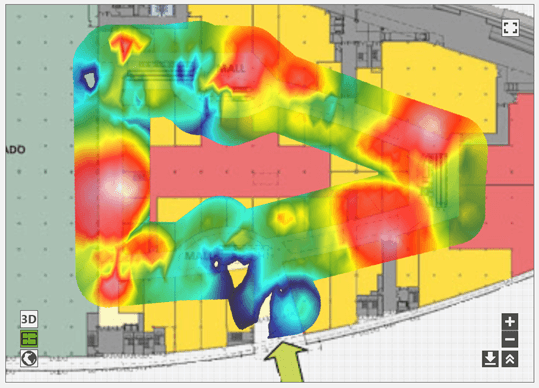
4.3.1.1.1. RSSI
![]() Heatmap representing RSSI or ‘Received Signal Strength Indication’ in the site survey area.
Heatmap representing RSSI or ‘Received Signal Strength Indication’ in the site survey area.
RSSI values range from 0dBm (strongest signal) to -100dBm (weakest signal).
Usual values range from -40 to -70.
4.3.1.1.2. AP Coverage
![]() This plot represents the access point with the best coverage for each area.
This plot represents the access point with the best coverage for each area.
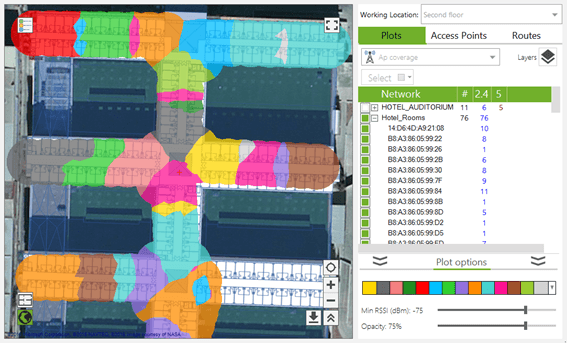
By visualizing each access point’s coverage area, you can spot those access points that are being underused. Therefore, you can relocate those access points to areas requiring more coverage, such as large and/or dense areas, in order to optimize network performance.
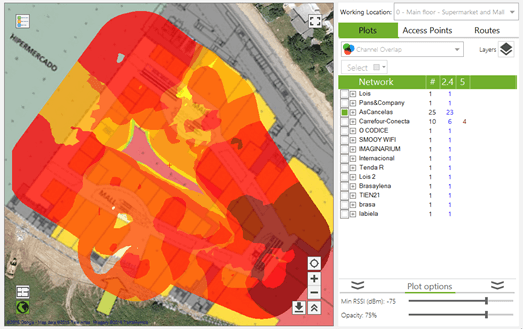
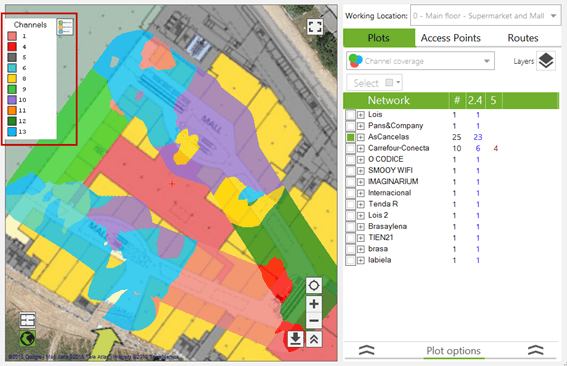
4.3.1.1.3. Channel Coverage
![]() This plot represents the channel received with the strongest signal for each point.
This plot represents the channel received with the strongest signal for each point.
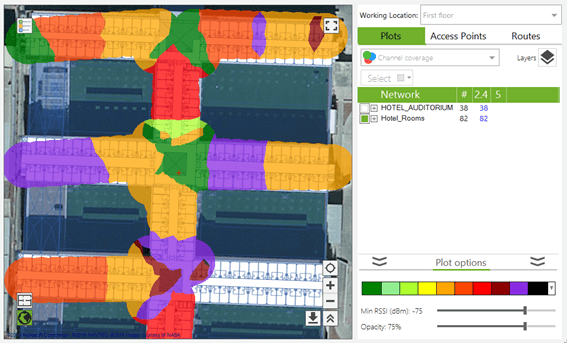
By visualizing channel distribution over a blueprint or satellite map, you are able to identify and correct channel overlapping, when detecting that geographically adjacent channel areas do not meet the minimum channel separation requirement of 5 channels apart.
4.3.1.1.4. Data Rates
![]() This plot represents the transmission rate supported by the access points with the better coverage for each point. It is important to cover the largest area possible at the closed transmission rate to the highest supported transmission rate. This rate does not imply that the highest supported transmission rate can be archived, since there are other factors impacting data transmission efficiency, such as signal strength, noise in the radioelectrical medium, network saturation, etc. In order to accurately measure actual bandwidth values, you need to perform a site survey on Active Mode.
This plot represents the transmission rate supported by the access points with the better coverage for each point. It is important to cover the largest area possible at the closed transmission rate to the highest supported transmission rate. This rate does not imply that the highest supported transmission rate can be archived, since there are other factors impacting data transmission efficiency, such as signal strength, noise in the radioelectrical medium, network saturation, etc. In order to accurately measure actual bandwidth values, you need to perform a site survey on Active Mode.
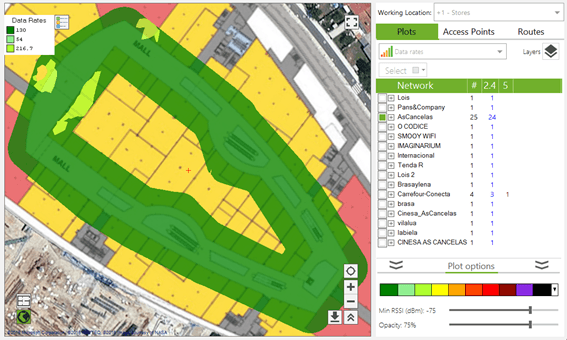
This transmission rate represents the maximum transmission rate supported by each access point. Even though an access point supports a certain maximum transmission rate, this maximum rate is not always achieved, due to noise in the radioelectrical medium, signal strength, number of client devices connecting the network, distance between access point and client device, etc. These factors can negatively impact the network’s performance.
NOTE: In order to know actual data transmission rate values, you need to run an active site survey.
4.3.1.1.5. Cell Density
![]() This heatmap represents the density of client devices connected to the selected access points. It displays the areas with the most client Wi-Fi devices, to identify those access points that need to be optimized to support a larger number of connections or those areas with high client device density where additional access points are required to prevent saturation on the existing ones.
This heatmap represents the density of client devices connected to the selected access points. It displays the areas with the most client Wi-Fi devices, to identify those access points that need to be optimized to support a larger number of connections or those areas with high client device density where additional access points are required to prevent saturation on the existing ones.
An area with a high client device density can negatively impact the network performance, since it will experience higher airtime utilization.
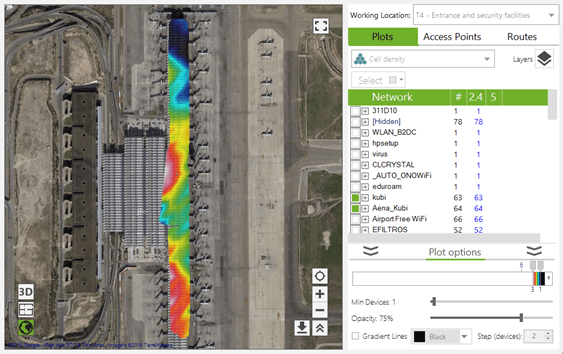
NOTE: This information is only available when the site survey is performed on Monitor Mode or using an Airpcap device.
4.3.1.1.6. Number of Access Points
![]() This plot represents the number of access points detected in each area.
This plot represents the number of access points detected in each area.
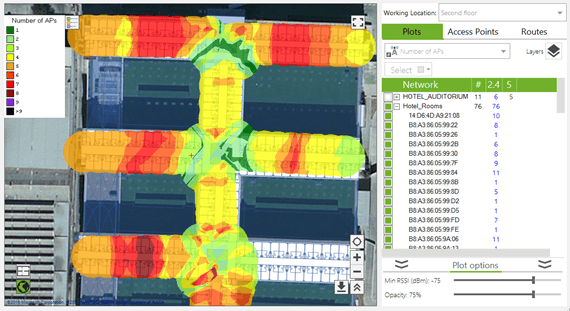
This plot complements the channel overlapping information. A high access point density can be beneficial as long as overlapping is low.
4.3.1.1.7. Retry Rate
![]() This plot represents the retry rate detected during the traffic analysis on Passive Mode.
This plot represents the retry rate detected during the traffic analysis on Passive Mode.
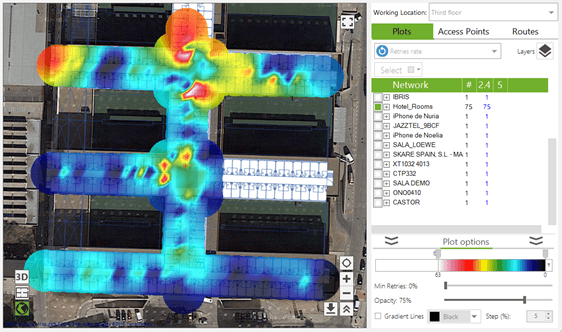
Generally, a data packet retry is the result of a failed transmission caused by interference, excessive noise in the wireless medium, or bad positioning of the client Wi-Fi device or broadcasting access point. It is important to identify areas with high retry rates to try improving network performance in those areas.
NOTE: Values over 10% are considered to have a negative impact on network performance.
These rates are calculated considering the traffic captured at a specific point in time, therefore, they are based on the data transmitted at that moment in time.
NOTE: This plot is only available if the site survey was performed on Monitor Mode or using an Airpcap device. A high rate value will result in decreased network performance.
4.3.1.1.8. Channel Coverage
![]() This plot represents the overlapping level of the channels used for each area. Co-/adjacent channel interferences are also included in this plot, so that these two parameters can be easily visualized.
This plot represents the overlapping level of the channels used for each area. Co-/adjacent channel interferences are also included in this plot, so that these two parameters can be easily visualized.
Adjacent channel interference is detected whenever a different access point is operating on an adjacent channel, causing transmission frequencies to overlap. This interference mostly depends on the channel bandwidth for each access point, and the signal strength differential (if lower than 20dBm).
On the other hand, a co-channel interference is detected when multiple access points operate on the same channel, and the signal strength differential is lower than 20dBm.
The higher the number of interfering devices, the lower the network performance. It is also desirable to try reducing overlapping as much as possible.
4.3.1.1.9. Detailed Grid
![]() This plot arranges the surveyed area in a grid, displaying gross data for each cell.
This plot arranges the surveyed area in a grid, displaying gross data for each cell.
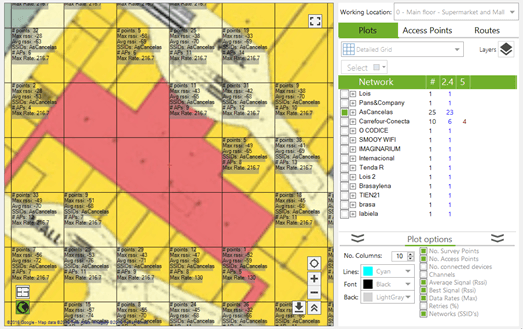
This plot helps visualizing actual data by segmenting the surveyed area.
4.3.1.1.10. Signal-to-Noise Ratio
![]() This plot displays the value for the relation between signal strength and noise in the wireless medium, also known as SNR, which is associated with the signal level a client device receives the data packets from the access point.
This plot displays the value for the relation between signal strength and noise in the wireless medium, also known as SNR, which is associated with the signal level a client device receives the data packets from the access point.
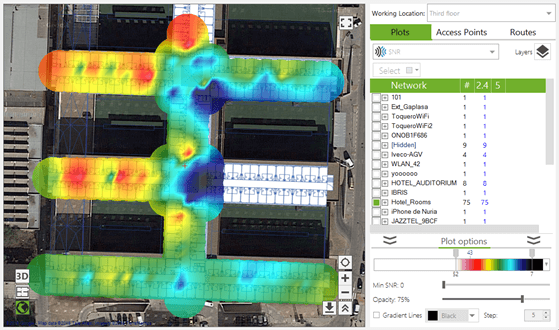
SNR is a good parameter to measure communications quality, since it considers signal strength and noise in the wireless medium.
Its value ranges from 0 (worst) to 100 (best). 60 or over is considered a good value.
NOTE: This plot is only available for site surveys performed using an Airpcap device.
4.3.1.1.11. RF Spectrum
![]()
Displays the 2.4 and 5GHz band radio emissions used in Wi-Fi communications
Represents the information collected from radioelectrical medium for the 2.4 and 5Ghz frequency bands.
Wireless transmissions operate on one of these bands, according to the 802.11 communication standard being implemented.
For each band, an access point operates in a frequency subset.
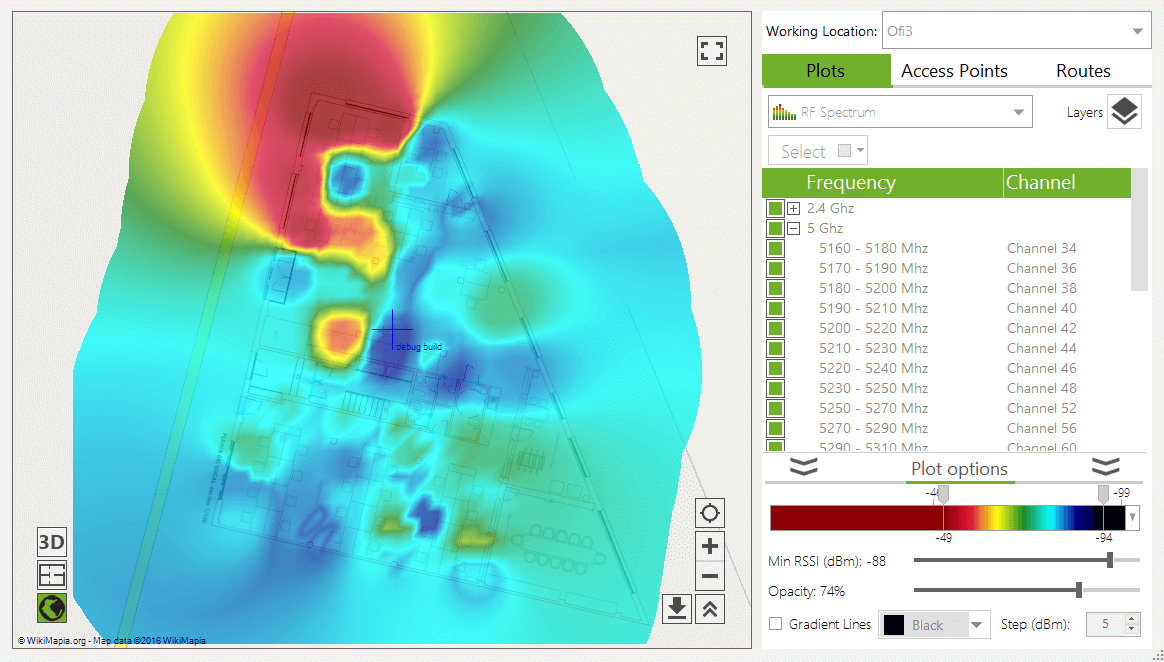
Depending on the access point configuration, and the 802.11 standard revision, networks can operate in frequency bandwidths of 20, 40, 80, or even 160 Mhz.
RF values range from 0dBm to -100dBm.
NOTE: This option is only available for site surveys which have been performed using a compatible spectrum analyzer.
4.3.1.2. Active Capture Plots
Plots that can be generated after performing a site survey on Active Mode are shown below.
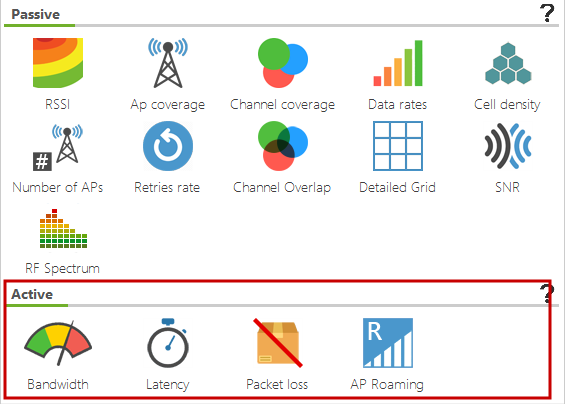
4.3.1.2.1. Bandwidth
![]() This plot represents the bandwidth in Kbps for each point covered by the site survey. The accuracy of this parameter varies according to the chosen method: iPerf or file download. For more information on the difference between these two methods, refer to the Active Capture section.
This plot represents the bandwidth in Kbps for each point covered by the site survey. The accuracy of this parameter varies according to the chosen method: iPerf or file download. For more information on the difference between these two methods, refer to the Active Capture section.
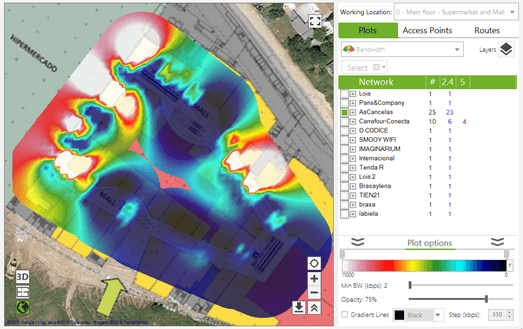
The larger the bandwidth, the higher the overall network performance.
For a fluid VoFi communication between two Wi-Fi devices, a minimum bandwidth of 430kbps is recommended.
4.3.1.2.2. Latency
![]() This plot represents packet latency in milliseconds, in other words, the time elapsed from a data packet is transmitted to the confirmation packet is received.
This plot represents packet latency in milliseconds, in other words, the time elapsed from a data packet is transmitted to the confirmation packet is received.
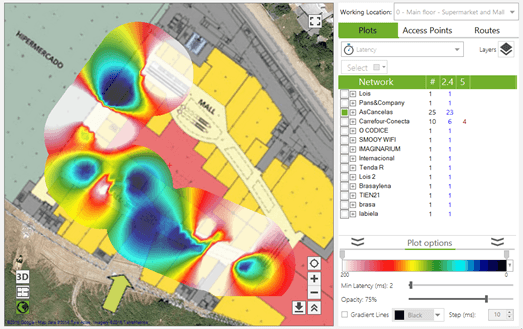
Latency is the time it takes for a packet to travel to its destination and back. This parameter is important for services requiring quick responses, such as VoIP communications, videoconferencing, and live media streaming.
Network latency values are associated with final user experience.
Recommended latency values are 150ms or less, on both ends. When performing the measurements, keep in mind that the server measuring your network’s latency is not the final call recipient, therefore, latency values should be 45ms or less.
4.3.1.2.3. Packet Loss
![]() The packet loss rate is the percentage of packets that are lost, in other words, that do not reach their destination, and that are usually retransmitted.
The packet loss rate is the percentage of packets that are lost, in other words, that do not reach their destination, and that are usually retransmitted.
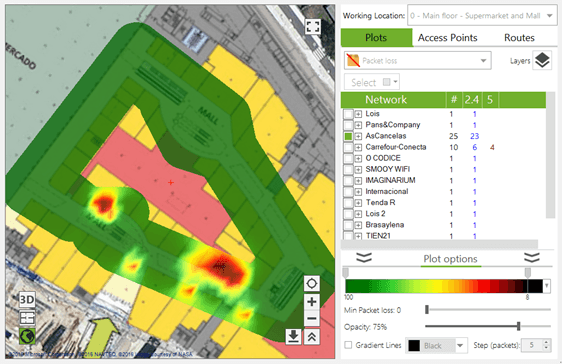
While packet loss observed on a passive capture represents the rate of Wi-Fi packets that had to be retransmitted, this value indicates the packets that have been lost in the Layer 4 of the OSI model.
For a good performance, lower rate values below 1% are recommended.
4.3.1.2.4. Roaming
![]() This plot catalogs the surveyed area based on data roaming performance in relation to the connected access point.
This plot catalogs the surveyed area based on data roaming performance in relation to the connected access point.
When moving along the surveyed area, keeping client device connectivity is desirable. Roaming allows moving devices to maintain wireless communication by connecting to new access points within the same network to maintain the quality of communication and prevent degradation of signal strength.
This plot displays the areas where connection was acceptable, as well as the connected access points.
Ideally, roaming should be supported across the whole coverage area, otherwise connectivity continuity and quality will be jeopardized and it will no longer be possible to keep wireless connection with a moving device, such as a VoIP telephone.
4.3.2. Plot Generation
Once the site survey measurements have been performed, the collected data can be analyze and visualized. Under the Plots tab, you can visualize the status of the selected networks according to multiple parameters, as detailed in section 4.3.1 (intensity, transmitting frequencies, channel overlapping, etc.)
Plot generation steps are shown below:
1. Select the type of plot to generate.
2. Select the access points.
Optionally, plot characteristics can be configured.
The plot is automatically regenerated as you select or deselect different access points.
By default, the data shown in a plot corresponds to all the scans performed in the selected location. If you want to generate plots based on disaggregated data for each scan, you need to use the Layers mode.
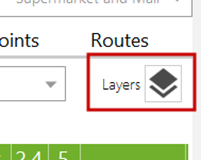
4.3.2.1. Layers
The multiple simultaneous plots mode (Layers ![]() ) allows you to select data from each plot in a disaggregated way, where you can select the collected data from one or multiple scans. This way, you can separately analyze all the parameters for each scan.
) allows you to select data from each plot in a disaggregated way, where you can select the collected data from one or multiple scans. This way, you can separately analyze all the parameters for each scan.
This mode allows multiple plot overlay. You can visualize at the same time a signal strength plot overlaying a SNR plot, or a channel overlapping plot. This feature is helpful when comparing network improvement in different moments in time after taking corrective actions, or for more advance analysis.
The steps to generate a plot on Layer mode are shown below:
1. Click on the Multiple Plots button.
2. Select the type of plot to generate.
3. Select the scans.
4. Select the access points.
This way, the generated plots are saved as a list of plots from which it is possible to select the desired plots to be displayed, or delete those plots that are no longer needed.
4.3.2.2. Visualization Modes
The generated plots can be visualized from three different views.
Satellite: Over the satellite image. For more information on this visualization mode, refer to the section 4.1.2.
Map: Over the location blueprint. For more information on this visualization mode, refer to the section 4.1.1.
3D: 3D representation. For more information on this visualization mode, refer to the section 4.1.3.
You can conveniently zoom in any of the three views to analyze the plots more closely using the panoramic view button (![]() ). By clicking on this button, the right panel is hidden, providing a larger plot visualization area. To restore the view to its previous mode, click on the
). By clicking on this button, the right panel is hidden, providing a larger plot visualization area. To restore the view to its previous mode, click on the ![]() button.
button.
4.3.2.2.1. Blueprint View
The plot is shown over the blueprint associated with the selected location.
Requirements for this visualization mode:
● The location requires an associated blueprint.
● The blueprint must be calibrated.
4.3.2.2.1.1. Saving a Plot
You can save the displayed plot by clicking on the ![]() button. The plot will be saved to a KMZ file that contains both graphical and geopositioning information. This type of files can be opened using GIS applications, such as Google Earth.
button. The plot will be saved to a KMZ file that contains both graphical and geopositioning information. This type of files can be opened using GIS applications, such as Google Earth.
4.3.2.2.2. Satellite View
The plot is displayed over the satellite image. If the location has an associated blueprint that has been already calibrated, then the blueprint shows overlaying the satellite image, and the plot, in turn, overlaying the blueprint.
Requirements for this visualization mode:
● The location must have an associated blueprint that has to be calibrated over the satellite image; or
● The scan has to be performed using a GPS device.
4.3.2.2.2.1. Satellite Mode Options
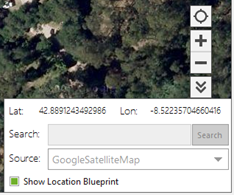
Clicking on the ![]() button unfolds all the available options for the Satellite view. From this panel, you can perform the following actions:
button unfolds all the available options for the Satellite view. From this panel, you can perform the following actions:
– View latitude and longitude of a view point. Hover you pointer over the areas where latitude and longitude values are wanted. The panel will immediately update this information.
– Search a desired address, city, or geographical point. Using the dialog window, you can enter the area to be geopositioned.
– Select the desired satellite image provider. Google Maps is the default satellite map provider. However, you can choose from many other providers, including Bing, OpenStreet, OpenCycle, etc. Each one of them offers different map versions, such as Map, Satellite, Hybrid, etc.
– A geopositioned map can be shown or hidden. This option is enabled by default.
4.3.2.2.2.2. Saving a Plot
You can save the displayed plot by clicking on the ![]() button. The plot will be saved to a KMZ file that contains both graphical and geopositioning information. This type of files can be opened using GIS applications, such as Google Earth.
button. The plot will be saved to a KMZ file that contains both graphical and geopositioning information. This type of files can be opened using GIS applications, such as Google Earth.
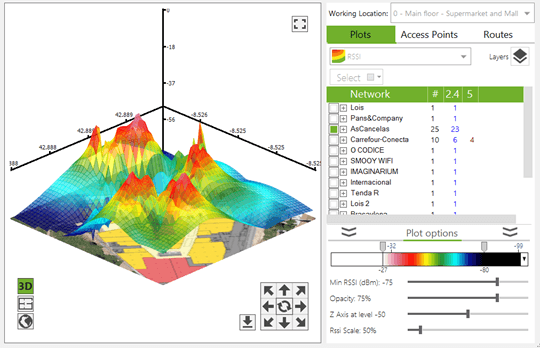
4.3.2.2.3. 3D View
This visualization mode displays the plots in an additional dimension that represents the value of the represented magnitude. This three dimensional representation of the plot is shown over the satellite and/or blueprint view(s), if the location has an associated blueprint.
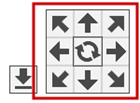
You can navigate this view using the direction arrows.
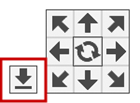
You can also save the 3D representation.
NOTE: The 3D view is available for the following plots:
|
|
|
|
|
|
|
|
|
4.3.2.3. Plot Options
The generated plots can be customized, from the Graphics options, in terms of appearance and data to be display. You are able to adjust parameters such as color scheme, maximum values, and values from which the data is discarded.
These parameters can be configured from a panel at the bottom of the network list and they are specific to each plot. The configuration parameters are different for each type of plot.
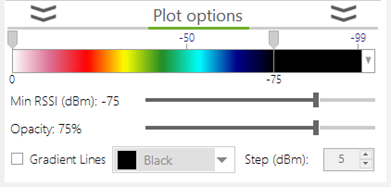
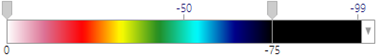
4.3.2.3.1. Color Scheme
The plots representing heatmaps and using color gradients to represent the collected data, allow you to select the desired color range that will be displayed in the plot, as well as its limits based on the magnitude value for that range.
Available for the following plots:
|
|
|
|
|
|
|
|
|
The plots representing areas with no gradients, with solid colors, allow you to select a list of colors for each one of the values.
Available for the following plots:
![]()
|
|
|
|
|
|
4.3.2.3.2. Min RSSI
It is possible to configure a threshold beyond which the plot is displayed. Values below the threshold are not represented in color, so there will appear as a transparent area.
![]()
Available for the following plots:
|
|
|
|
|
|
|
|
|
|
|
|
|
|
4.3.2.3.3. Opacity
This is the plot transparency level that applies when it overlays the blueprint or satellite view.
![]()
Available for the following plots:
|
|
|
|
|
|
|
|
|
|
|
|
|
|
|
4.3.2.3.4. Gradient Lines
The plots can display gradient lines. These gradient lines connect points with the same magnitude values within the plot.
![]()
Available for the following plots:
|
|
|
|
|
|
|
|
|
4.3.2.4. Detailed Grid
For the Detailed Grid plot, you can define which parameters are displayed, showing the selected parameters in each one of the cells.
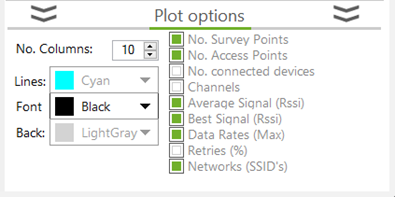
Available for:
|
|
4.3.2.5. Legend
Legends can be displayed when it is necessary to identify a color with a certain parameter value, such as channel, BSSID, etc.
For those plots displaying legends, an icon on the left upper corner is shown, for both Satellite and Blueprint views.
Available for:
|
|
|
|
|
|
|
4.3.3. Access Points
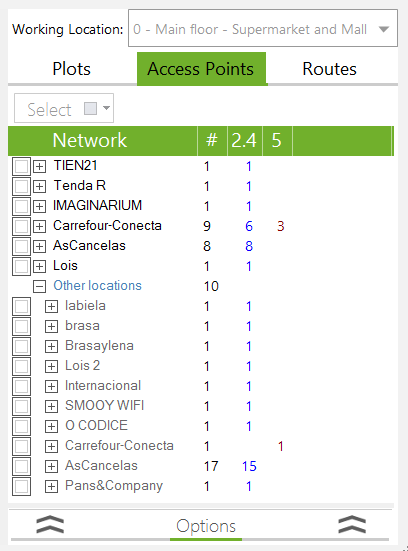
This section shows the networks identified during the scans performed in the selected surveyed area. For each one of these networks, the access points publishing each network are shown.
To visualize the location of an access point, this has to be selected using the rectangle selection pointer.
Acrylic Wi-Fi Heatmaps can triangulate and geoposition the access points and detect if the belong to the surveyed area. Once a site surveyed is completed, Acrylic Wi-Fi Heatmaps analyzes the detected access points and compares the results against all the scans performed on all other locations to detect if the access points belong to the surveyed area.
A threshold beyond which an access point is not automatically located can be defined in the Acrylic Wi-Fi Heamaps configurations. This is particularly useful when performing scans in locations with a large number of access points and adjacent wireless networks, while focusing on the closest access points with the strongest signal.
All access points within the current location are displayed in the table sorted by network name.
In case an access point belongs to a different location, it is categorized under the Other Location element. If an access point is not identified with any particular location, it appears under this element and cannot be selected to be displayed in the active view.
On the bottom you will see a panel, minimized by default, displaying access point options and detailed information.
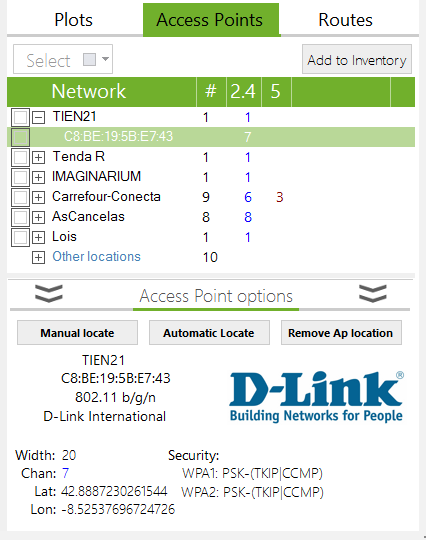
4.3.4. Locating an Access Point
The access points detected during a scan, which signal strength values are higher than the predefined minimum signal strength thresholds, are automatically located.
If you want to modify or adjust either the physical location or the access point association with a project’s location, there are several options to perform this task manually. To use these options, the access point to be modified has to be selected.
4.3.4.1. Manual Location
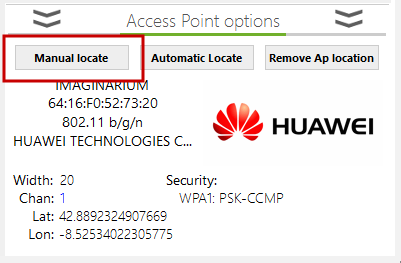
This option allows to manually locating an access point. Manual location overrides automatic location. This means that despite the fact that an access point has been detected in a different location with a stronger signal level, by manually locating the access point, it is assigned to the selected location.
After clicking on the button to manually locate the access point, you need to indicate the location of the access point by clicking on the blueprint or satellite view.
4.3.4.2. Automatic Location
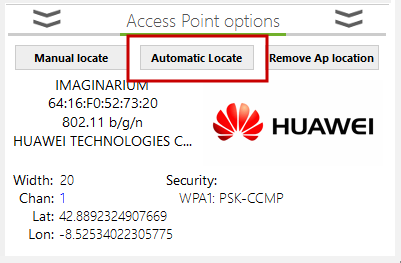
This option allows to automatically locating an access point. Acrylic Wi-Fi Heatmaps processes the data collected for the selected access point, and using geopositioning and triangulation algorithms, the software establishes the access point’s most probable location.
In case an access point has been previously manually located, its location will be overridden by selecting this option.
4.3.4.3. Remove AP Location
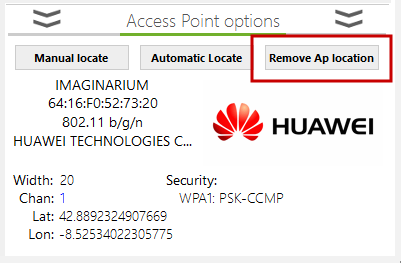
This option removes the location of an access point. This way, the access point will no longer be geopositioned.
After being removed, the access point will be included into the Other Locations group, but it will not visible until it is assigned a new location.
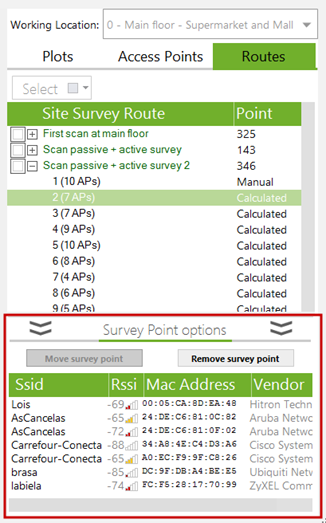
4.3.5. Routes
This section shows the list of locations that have been scanned in the selected surveyed area.
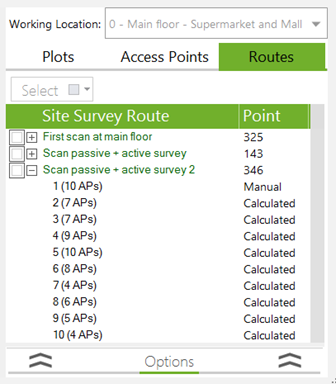
When scanning a location, data collection points are created along the way. These scanning points indicate Acrylic Wi-Fi Heatmaps where the data has been collected.
Based on how the site survey is performed (the scan in particular), points are classified in four types:
|
Type of Scan |
Description |
|
Manual
|
These points have been manually selected from the These points are generated during a scan on Normal |
|
Calculated
|
This type of points is generated during a site Acrylic Wi-Fi Heatmaps performs measurements between two points defined by the user, and |
|
GPS
|
This type of points is automatically generated by Acrylic Wi-Fi Heatmaps during a GPS enabled scan for each GPS coordinate.
By using this type of data acquisition, it is |
|
Embedded
|
This type of points is automatically generated by Acrylic This service uses the geopositioning providers |
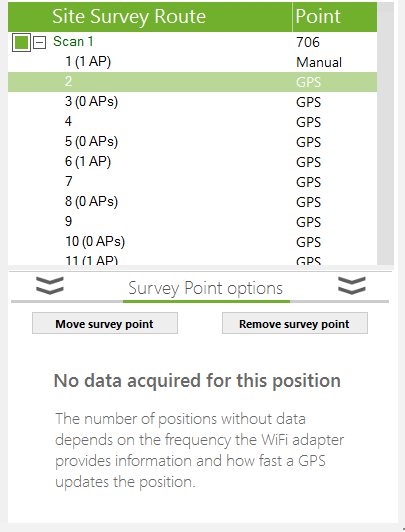
4.3.5.1. Options
When selecting a point, all the available options are shown on the bottom context panel, such as Move Point, Delete Point, etc, including the information on the access points detected in that point.
To move a point, click on the Move Survey Point button, and select the point position on the blueprint or satellite map.
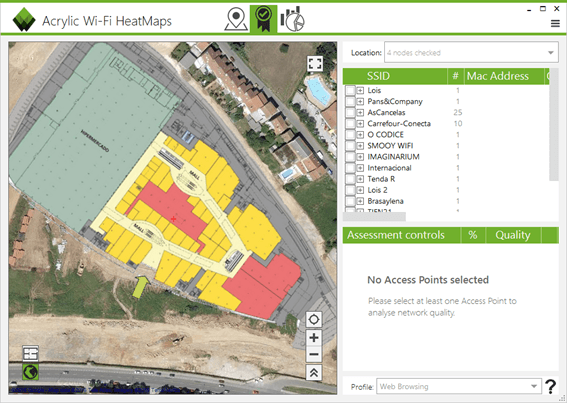
5. Wi-Fi Quality
Introduction
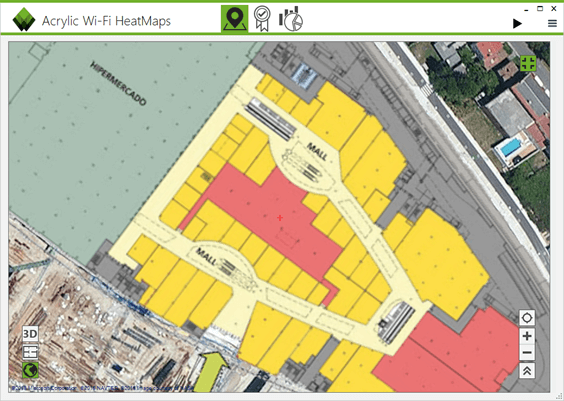
Acrylic Wi-Fi Heatmaps includes a tool to analyze and evaluate Wi-Fi network quality based on predetermined parameters. This tool generates two-color graphics, categorizing the different areas in the selected location in green and red. An area is displayed in green when the quality predefined requirements are met, and in red when those requirements are not met.
These automatic controls can quickly and easily identify the wireless network weaknesses and issues.
A Wi-Fi quality assessment allows the user to visualize actual wireless infrastructure status, providing an overview of the network status based on quality parameters.
The Assessment Controls included in the Wi-Fi network quality assessment generate two-color graphics, green ![]() to represent those areas where quality requirements are met, and red
to represent those areas where quality requirements are met, and red ![]() to represent those areas where minimum quality requirements are not met. A quality control list is also generated, showing percentage of compliance for each control.
to represent those areas where minimum quality requirements are not met. A quality control list is also generated, showing percentage of compliance for each control.
Control requirements are grouped by Profiles, being quality analysis based on network usage their main purpose. By default, Acrylic Wi-Fi Heatmaps offers two different profiles: Web Browsing and VoIP. Each one of them defines minimum requirements to guarantee browsing and VoIP support.
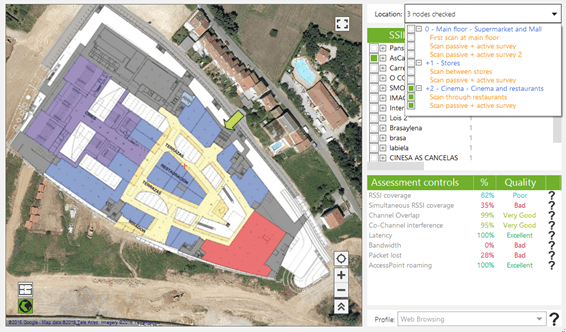
The steps to analyze network quality are shown below:
1. Select the scans on a location where the quality controls are to be applied.
2. Select the access points to which the quality controls are o be applied.
3. Hover over the control to be applied over the blueprint or satellite map view.
4. If necessary: Select the Wi-Fi Quality profile.
5.1. Wi-Fi Quality Sections
The Wi-Fi Quality module offers multiple sections to work on:
5.1.1. Location
This section contains a list of locations and the scans performed during the site survey. Here you can select the locations and the scans over which the quality controls will be applied.
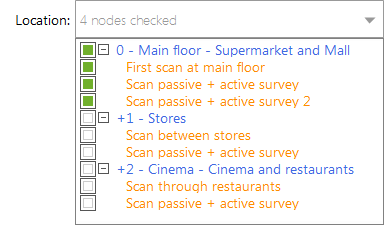
NOTE: The controls can only be applied to a single location. Therefore, you can only select scans within a same location.
5.1.2. Access Points
This section displays all access points identified during the selected scans.
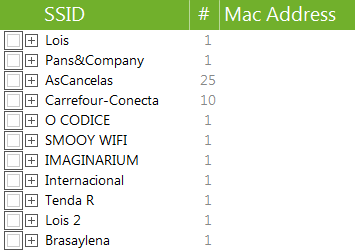
Wi-Fi quality controls are only applied to the selected access point(s).
5.1.3. Quality Assessment Controls
This table shows the Wi-Fi network quality controls to be applied to the selected access points and the results obtained.
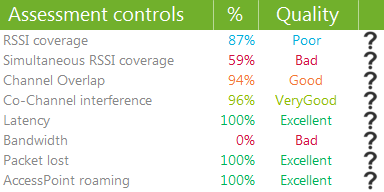
When selecting a quality control, you will see the graphic resulting from applying the control to the selected site survey areas.
The green color on the graphic indicates those areas where the minimum predefined quality requirements have been met for the selected control. On the other hand, the red color indicates that those requirements have not been met.
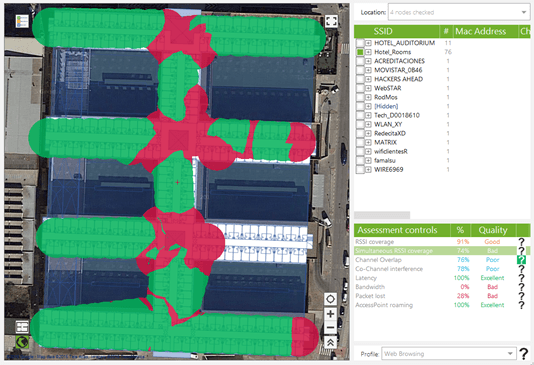
The following table details the content of the columns of the Control section:
|
Assessment Control |
Name of the Wi-Fi Quality Control |
||||||||||||||
|
% |
It indicates the percentage of the area covered by the site survey that meets the predefined requirements for the selected control. Control parameters can be configured by editing the control’s Profile. Example: If a control has a RSSI minimum threshold of -75, the area with a RSSI equal or higher than -75 will be displayed in green, while the area with a RSSI lower than -75 will be displayed in red. |
||||||||||||||
|
Quality |
This parameter shows, as a compliance percentage, the resulting wireless network quality after applying the quality control requirements to the selected network.
|
The Wi-Fi network quality controls applied by Acrylic Wi-Fi Heatmaps are shown in the following table:
|
Assessment Control |
Description |
Site Survey |
|
RSSI |
It verifies that the RSSI thresholds are met within the Passive site survey coverage area. |
Passive |
|
Simultaneous RSSI Coverage |
It verifies that the RSSI thresholds are met within the site survey coverage area. It is verified that there are enough access points to provide the dependability defined in the selected profile. |
Passive |
|
Channel |
It verifies that there is no channel overlapping interference within the site survey coverage area. |
Passive |
|
Co-Channel Interference |
It verifies that there is no co-channel interference within the site survey coverage area. |
Passive |
|
Latency |
It indicates if the latency value during the active site survey is lower than the predetermined threshold value. |
Active |
|
Bandwidth |
It verifies that the bandwidth across the site survey coverage area meets the requirements specified for the selected profile. |
Active |
|
Packet |
It verifies that the packet loss rate is lower than the predefined threshold value. |
Active |
|
AccessPoint Roaming |
It indicates if Roaming has worked correctly during an active site survey scan. |
Active |
5.2. Profiles
A Wi-Fi quality control profile establishes each control’s minimum service quality requirements for a dependable wireless network performance.

For example, the Web Browsing profile establishes minimum bandwidth values, as well as maximum latency values, and ensures a satisfactory web browsing experience for the connected users.
By default, Acrylic Wi-Fi Heatmaps provides two threshold configurations and parameters for each one of the Wi-Fi Quality controls. These parameter sets are grouped within the Profiles:
5.2.1. Default Profiles
● Web Browsing: Standard wireless network configuration that ensures web browsing service to all wireless client devices.
● VoIP: This is the most important wireless network configuration to guarantee the necessary service quality required for VoIP communications through the wireless network.
5.2.2. Creating and Editing Profiles
To create new profiles or edit existing ones, go to Preferences (Main Menu à Configure), Wi-Fi Quality section:

NOTE: The default profiles included in Acrylic Wi-Fi Heatmaps cannot be deleted, but their configuration parameters can be edited to adjust to the infrastructure manufacturer’s requirements.
5.3. Wi-Fi Quality Controls
The function of each control listed in the previous section is shown below:
5.3.1. RSSI Coverage
The RSSI Coverage control displays in green those areas where the signal strength received from any of the selected access points falls below the selected threshold value.
Signal strength has a significant impact on the quality of wireless communications. Signal strength is measured in dBm, and ranges from 0 dBm (strongest) to -100 dBm (weakest).
Acceptable values range from 0 -75 dBm. Proper communication cannot be guaranteed with lower signal strength values.
This control displays in green those areas where the RSSI Coverage requirements are met, and in red those non-compliant areas.
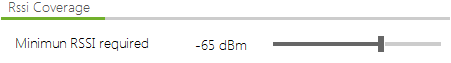
Minimum requirement values depend on the selected profile. Normally, at least a -65dBm signal strength is required.
These values can be configured from the Configure option in the main menu, under the Wi-Fi Quality section (RSSI Coverage).
5.3.2. Simultaneous RSSI Coverage
The Simultaneous AP Coverage control displays those areas where the signal strength received from a number of the access points is equal or higher than the predetermined threshold value.
To ensure dependable wireless communications, it is necessary, under certain circumstances, that all the points in the coverage area can access a certain number of access points within the network infrastructure, preventing channel overlapping, with at least the minimum required signal strength.
These requirements depend on the type of infrastructure being analyzed and they can be configured in the profile. For example, VoFi (Voice over Wi-Fi) service typically requires connectivity with two access points with at least -65dBm signal strength.
Those site survey areas meeting these requirements are displayed in green. Non-compliant areas are shown in red.
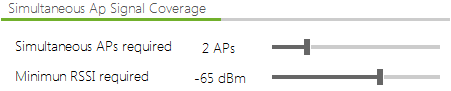
These values can be configured from the Configure option in the main menu, under the Wi-Fi Quality section (Simultaneous RSSI Coverage).
5.3.3. Channel Overlapping
The Channel Overlapping control shows those areas where adjacent interference requirements are met. An access point is considered to have an adjacent interference when there is another access point operating on an adjacent channel, and due to the channel bandwidth in the communications, some of the frequencies transmitted by the access points overlap. This causes interferences that decrease the signal quality.
Example: If an access point is operating on channel 1 over the 2.4Ghz band, and there is another access point transmitting on channel 2 over the same 2.4Ghz band, this one could be interfering and degrading the quality of the communications.
These interferences not only depend on the selected channel, but on channel bandwidth. The 2.4Ghz frequency band (802.11 b/g/n) supports channel bandwidth values of 20 and 40 Mhz. The 5Ghz frequency band (802.11 a/n/ac/ad) supports channel bandwidth values of 20, 40, 80, and 160Mhz.
Besides frequency and bandwidth, these interferences also depend on the level of overlapping between two signals, that is to say, the signal strength from the interfering access point. If there is enough intensity differential (in case the signal transmitted by our access point is received with higher intensity), then the communications will not be impacted by an adjacent interference.
A difference of at least 20dBm in signal intensity is enough to prevent network performance degradation.
Example: If a wireless network is operating on channel 1, it is received in a certain area at a signal strength of -65dBm and, in this same area, a -50dBm signal strength is detected from another access points operating on channel 2, the wireless network performance will be degraded by channel overlapping since there is a -15dBm differential.
This control displays in green those areas where Channel Overlapping requirements are met, and in red those non-compliant areas.
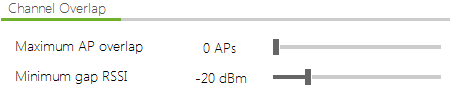
The required values for this control will depend on the selected profile. A surveyed access point is usually required to exceed all other potentially overlapping transmissions by at least 20dBm.
Ideally, the number of interfering access point transmissions should be 0.
These values can be configured from the Configure option in the main menu, under the Wi-Fi Quality section (Channel Overlapping).
5.3.4. Co-Channel Interference
The Co-Channel control displays those areas where the co-channel interference requirements are met. An access point is considered to have a co-channel interference when there is another access point operating on the same channel.
The IEEE 802.11 standard contemplated this issue. This type of interference results from two or more access points sharing the same radioelectric spectrum and taking turns while only one of them is able to transmit at a time.
These interferences downgrade communications quality when it comes to consider wireless medium availability before transmitting. While an access point is transmitting, the other access points operating on the same channel have to wait for their turn. This causes transmission delays among the access points operating on the same frequency.
Besides same-channel operation, these interferences are also affected by the overlapping signal strength. In case of high signal strength differential (in other words, the access point signal is significantly stronger than the interference), then the communication will not be negatively impacted by a co-channel interference.
A 20dBm signal strength differential is high enough to prevent network communications downgrade due to interference.
This control displays in green those areas where Co Channel requirements are met, and in red those non-compliant areas.
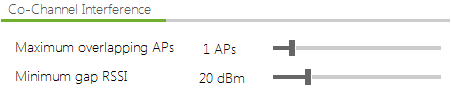
The required values for this control will depend on the selected profile. Usually, the surveyed access point is required to exceed overlapping same-channel transmissions by at least 20dBm. Normally, the number of allowed co-channel interferences is limited to 1.
These values can be configured from the Configure option in the main menu, under the Wi-Fi Quality section (Co-Channel Interference).
5.3.5. Latency
The Latency control displays those areas where the predetermined minimum latency requirements are met.
Latency is the time it takes for a packet to travel to its destination and back.
The factors affecting latency can be classified in two types: fixed and variable.
Fixed factors are those that would always cause the same delay, such as signal encoding or decoding, preparation for sending the signal, etc.
Variable factors usually impact latency the most. Some examples are the queuing delays, transmission errors, packet retries, data contention and congestion, etc.
In a VoFi (Voice over Wi-Fi) communication, optimal latency values should be lower than 150ms. During a voice communication, data is transmitted in a large amount of small-sized packets, each containing a small portion of the audio being transmitted. The delay between transmission and reception of the sound should be kept to the minimum to guarantee a fluid conversation.
In order to visualize latency, a site survey should be performed with the Active Survey option enabled. When the Active Survey option is enabled, bandwidth and latency measurements are taken at the same time during a passive site survey.
This information is processed to display those areas where the control requirements defined in the selected control profile are met. This control displays in green those areas where latency requirements are met, and in red those non-compliant areas.
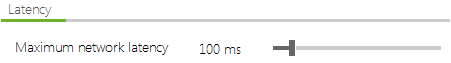
The required values for this control will depend on the selected profile.
These values can be configured from the Configure option in the main menu, under the Wi-Fi Quality section (Latency).
5.3.6. Bandwidth
The Bandwidth control ensures that minimum bandwidth quality requirements for the connection established by the active survey are met across the coverage area.
This control displays in green those areas where bandwidth quality minimum requirements are met, and in red those non-compliant areas.
This control is only available when the Active Survey option is enabled during a site survey.
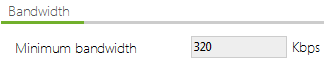
The minimum bandwidth value is determined by the selected profile.
These values can be configured from the Configure option in the main menu, under the Wi-Fi Quality section (Bandwidth).
5.3.7. Packet Loss
The Packet Loss control displays those areas where minimum packet loss requirements are met.
The packet loss rate is the percentage of packets that are lost, and do not reach their destination during a communication. Packet loss has a negative impact on network performance.
Packet loss rate values of under 10% are acceptable and will have a negligible impact on network performance in most cases.
To visualize the packet loss percentage, the site survey should be performed with the Active Survey option enabled. Using this information, it is possible to calculate packet loss rate for each location.
This control displays in green those areas where Latency requirements are met, and in red those non-compliant areas.

The required values for this control will depend on the selected profile.
These values can be configured from the Configure option in the main menu, under the Wi-Fi Quality section (Packet Loss).
5.3.8. AccessPoint Roaming
The Roaming control shows those areas where a client device can move along the surveyed area without experiencing connection interruptions by connecting to the different network’s access points.
Normally, in a wireless infrastructure, multiple access points are deployed to provide coverage throughout the desired area. Roaming allows moving devices to maintain wireless communication by quickly connecting to new access points within the same network to maintain the quality of communication and prevent degradation of signal strength. This service is called Roaming.
To visualize Roaming performance, the Active Survey option should be enabled during a site survey.
This option displays in green those areas where Roaming was successfully maintained by keeping devices connected to the wireless network, and in red those non-compliant areas.

This control required no configuration, since it evaluates whether roaming was successful or not.
6. Reports
Introduction
Once the scans have been completed, detailed reports can be created to present the project’s results. The result reports can be created in three different formats, with three detail levels, depending on to whom the report is intended for.
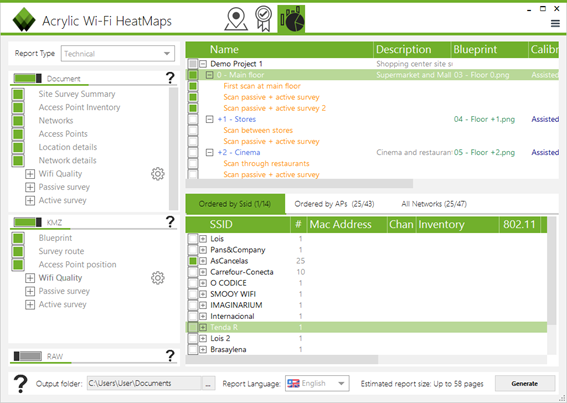
6.1. Report Types
There are different types of reports, depending on whom the report is intended for, each one with different detail levels.
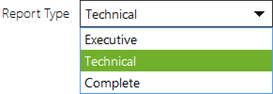
Report sections and contained information are configured when selecting one of the three report types from the pull-down menu.
These are the configurations that enable or disable the final report sections. If you need a report with more o less detail level, you can manually select or delete sections.
6.1.1. Executive
This type of report includes a summary of the site survey project results.
It briefly explains by means of graphics and tables how the survey has been performed, which access points have been analyzed, and the results obtained after applying Wi-Fi Quality controls that indicate whether the network meets the predefined requirements.
This type of report is oriented to managerial level recipients, and they provide an overview of wireless infrastructure status.
By default, this type of report is only generated in the editable Word format (.docx).
6.1.2. Technical
This type of report is more thorough than the executive report. This report includes the information contained in the Executive report, along with more technical information that has been analyzed during the site survey, sorted by the different study parameters.
Since this report is more thorough and includes detailed information, it is perfect for technical staff, so they can study, analyze, and justify technical elements.
The report provides a large number of heatmaps and plots, intended to visually represent the actual wireless network status, and provide technical details and information.
By default, this report is generated in the editable .docx format, but it can also be generated in KML/KMZ format (Keyhole Markup Language) that is used to represent geographical information, and can be opened using a GIS (Geographic Information System) tool.
6.1.3. Complete
This type of report combines the information included in Executive and Standard reports, and it also contains detailed graphics for every access point and for each one of the site survey parameters.
This report is highly technical and offers a great number of plots for each surveyed wireless network. This is also an extensive type of report, which is useful at the time of evaluating and analyzing each access point individually.
The generated plots included allow visualizing the represented parameters individually, to analyze each access point separately as well as the global plot.
An editable text report is provided, as well as a KML and RAW format reports with all the extended information.
Depending on the dimensions of the surveyed wireless network infrastructure and the number of locations, this type of report may have hundreds of pages.
6.2. Output Formats
Acrylic Wi-Fi Heatmaps provides three types of report output file formats that can be used to generate deliverables, to visualize the collected data in a GIS tool, or to export the data and use it in external applications.
6.2.1. Document
This report is generated in a .docx format file, a standard open source file format. These files can be easily opened and edited using several commercial and free office suites.
The information contained in this type of reports is sorted by sections, which can be configured from the Acrylic Wi-Fi Heatmaps document manager. The file has the following sections:
|
Section |
Description |
|
Site Survey Summary |
This section is an overview
In the first place, you can
Next, you are presented an ● ● NOTE: Only shown if more than one location is included in ● NOTE: Only ● NOTE: Only ● ● ● |
|
Access Point Inventory |
This section shows a table listing all the Once inventoried, the devices are show in the report NOTE: In case there |
|
Networks |
This section displays a
For each network, their publishing |
|
Access Points |
This section shows the information on the physical For each physical access point (an access point can If any of these physical access points is detected |
|
Location Details |
This section is included in
The section provides
Additionally, it shows the
Finally, the positions of |
|
|
Wi-Fi devices can transmit on two different frequency bands, 2.4 GHz and 5GHz, depending on the 802.11 communication standard they use.
Within these bands, Access Points transmit on a certain subset of frequencies. Depending on its configuration and the revision of the 802.11 standard they use, APs can operate with 20, 40, 80 and 160 MHz channels.
This section shows any transmission on the 2.4GHz and 5GHz bands, either produced by a Wi-Fi device or not.
NOTE: This information is only available when the site survey is performed using a compatible spectrum analyzer. |
|
Network Details |
This section includes all the networks detected that In the first place, the information is shown as a Next, the information is presented as a table, Finally, the positions of all the detected access |
|
Wi-Fi Quality |
A Wi-Fi quality assessment
You can configure as many
● ● ● ● ● ● ● ● |
|
Passive Survey |
This section includes the following plots resulting ● ● ● ● ● ● ● ● ● ● You can configure plot parameters such as colors and |
|
Active Survey |
During a capture on active
Data packets are sent and
This section includes the ● ● ● ●
You can configure graphic |
6.2.2. KMZ
The KML/KMZ (Keyhole Markup Language) format is normally used to represent geographical data. You can open these files using GIS (Geographic Information System) visualization tools such as Google Earth.
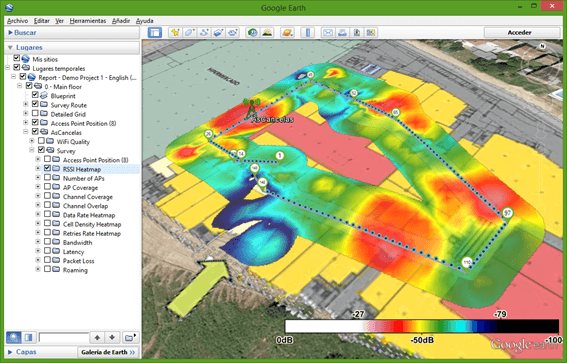
The following information will be shown for each location:
|
Section |
Description |
|
Blueprint |
The associated plan or
Including a plan or |
|
Survey Route |
Location information includes the routes followed |
|
Access Point Position |
Location information
When clicking on each one |
|
|
Wi-Fi devices can transmit on two different frequency bands, 2.4 GHz and 5GHz, depending on the 802.11 communication standard they use.
Within these bands, Access Points transmit on a certain subset of frequencies. Depending on its configuration and the revision of the 802.11 standard they use, APs can operate with 20, 40, 80 and 160 MHz channels.
This section shows any transmission on the 2.4GHz and 5GHz bands, either produced by a Wi-Fi device or not.
NOTE: This information is only available when the site survey is performed using a compatible spectrum analyzer. |
|
Wi-Fi Quality |
A Wi-Fi quality assessment You can configure as many profiles as you want to The two profiles that ● ● ● ● ● ● ● ● |
|
Passive Survey |
This section includes the
You can configure plot ● ● ● ● ● ● ● ● ● ● |
|
Active Survey |
This section includes the following plots resulting You can configure plot parameters such as colors and ● ● ● ● |
6.2.3. RAW
A RAW format report is made up of gross measurement data, and it is saved as a Comma-Separated Values (CVS) text file that is arranged in rows and columns.
This type of report allows you to export the data for later use on third-party applications.
The file comprises the following columns:
|
Column |
Description |
|
Point# |
Sequential number that |
|
Latitude |
Latitude of the point where the measurement was NOTE: You will only |
|
Longitude |
Longitude of the point
NOTE: You will only |
|
Altitude |
Altitude of the point where the measurement was NOTE: You will only |
|
Accuracy |
GPS precision of the point
Normal GPS accuracy values
NOTE: Accuracy is only ensure in case the |
|
Source |
The type of point where the measurement was ● ● ● ● |
|
X |
X position en pixels per
NOTE: In case of using a calibrated blueprint, |
|
Y |
Y position in pixels per NOTE: In case of |
|
LocationID |
Unique number that |
|
LocationName |
Name of the scan where the measurement was |
|
ScanID |
Unique number that |
|
ScanName |
Name of the scan where the measurement was |
|
MacAddress |
MAC address of the detected |
|
InventoryName |
Name of the inventoried device. NOTE: Only applicable |
|
SSID |
Name of the network |
|
Vendor |
Device manufacturer. This information is extracted |
|
RSSI |
Surveyed network signal strength. |
|
SNR |
Signal-to-Noise Ratio. Relation between signal strength and noise. NOTE: This value is |
|
Chan |
Channel on which the access |
|
Frequency |
Frequency on which the access point is operating. |
|
ChanWidth |
Bandwidth of the channel on |
|
802.11 |
Communication standard used by the access point. Possible values are: · · · · · · |
|
Rates |
Transfer rates supported by |
|
WEP |
WEP encryption type: ● ● |
|
WPA |
WPA encryption type. |
|
WPA2 |
WPA2 encryption type. |
|
WPS |
Determines whether the |
|
Type |
Informs the type of connection supported by the Possible values are: ● ● |
|
PacketCount |
Information only available for site
It indicates the number of |
|
PacketsFail |
Information only available for site surveys It indicates the number of PING requests to a server |
|
LatencyMs |
Information only available
Indicates average latency |
|
BitsPerSec |
Information only available for site surveys Indicates the available bandwidth in this |
|
ConnectedAP |
Information only available
MAC address of the access |
|
SSIDConnectedTo |
Information only available for Active surveys. Name (SSID) of the access point to which connection will be establish. |
|
Spectrum Frequencies |
This information is only available when the site survey is performed using a compatible spectrum analyzer. Each column represents a frequency and the values obtained at that point. |
6.3. Data Selection
To generate a report, you first need to select, among all the collected information, the access points on which the report is generated, as well as the locations and scans that will be included.
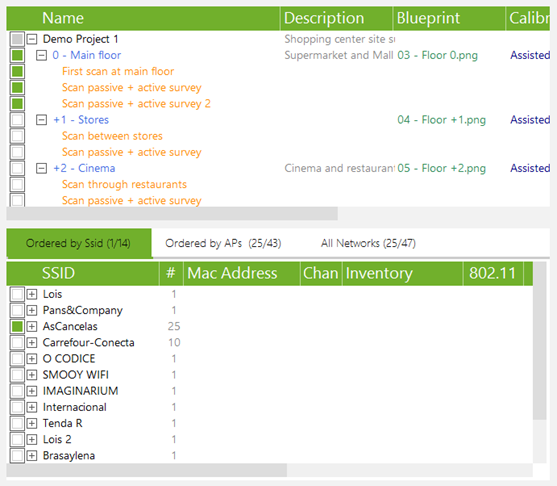
To select this information, follow the steps below:
– Select the locations and, from within them, the scans that will be included in the report.
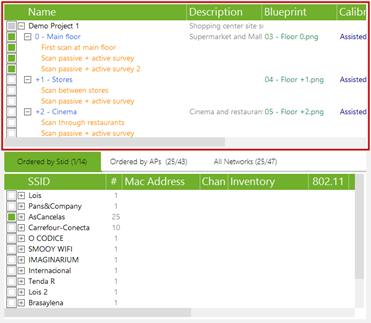
– Select the access points that will be included in the report.
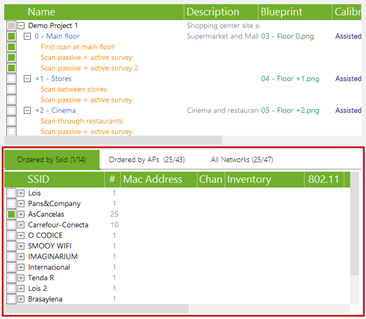
6.4. Additional Configurations
While generating a report, you can also select report language, as well as the destination or output folder for the documents.
You can define the report language among all available languages.
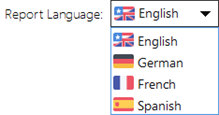
All the generated reports (DOC, KMZ, and CSV formats) are saved to the selected output folder.
![]()
NOTE: When generating an editable format report (DOCX), the estimated number of pages of the report will be shown. This information is merely informative, although quite accurate.
In case the generated document is too large, a warning is shown so you can review the report’s configuration and the number of selected elements if necessary.
Generating documents of over 200 is not recommended, since large documents are usually harder to handle, visualize, or print out. In such a case, it is recommended to generate individual reports per network or location.
7. Configurations and Aditional Features
Introduction
Apart from the main features that have been previously described that allow you to perform a complete site survey, Acrylic Wi-Fi Heatmaps has a series of additional features, mostly configuration options, that allow you to establish parameters to modify the software’s behavior.
7.1. Configure
The Configure window contains all the configurable options of Acrylic Wi-Fi Heatmaps. All the changes applied are saved and remembered for future sessions.
7.1.1. Main
This Acrylic Wi-Fi Heatmaps configuration section contains the general options of the software.
– Acrylic Wi-Fi Heatmaps software updates.
– Error corrective actions.
– Wi-Fi device chipset manufacturer (OUI) list updates.
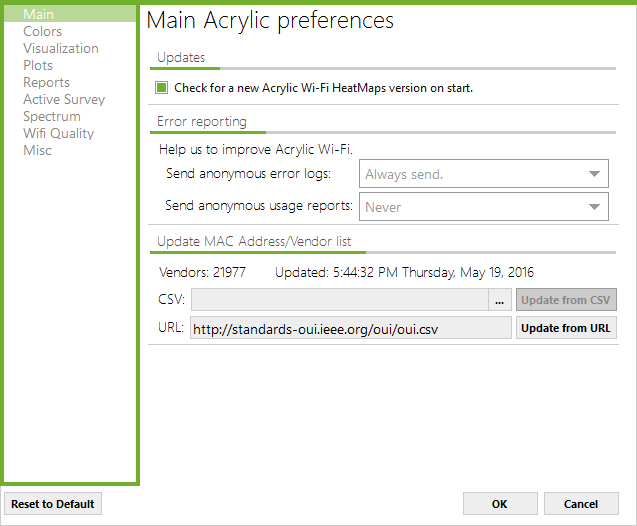
7.1.1.1. Updates
You can enable or disable automatic updates for Acrylic Wi-Fi Heatmaps. If this option is checked, Acrylic Wi-Fi Heatmaps will check for new software versions at startup, and will prompt you if you would like to continue with the update process.

Automatic updates are recommended, since they improve the software performance and functionalities and provide hotfixes.
7.1.1.2. Error Reporting
This option allows you to send anonymous error reports.
If while using Acrylic Wi-Fi Heatmaps you experience any kind of software error or bug, you are prompt if you want to anonymously send the bug to the Acrylic Wi-Fi Heatmaps software development team so we can identify the cause of the issue to fix it.
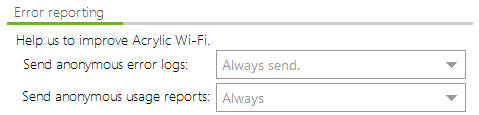
It is recommended to always send the error reports to help us fix all reported issues as soon as possible.
7.1.1.3. Update MAC address
This option allows you to manage the wireless device database to identify each device manufacturer by MAC address.
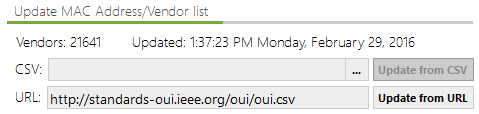
This database, also known as Organizationally Unique Identifier (OUI) is maintained by the Institute of Electrical and Electronics Engineers (IEEE). Note that the device manufacturers may have opted out of this database, therefore some devices may not be associated with their respective manufacturers.
7.1.2. Colors
This Acrylic Wi-Fi Heatmaps configuration section allows you to set the colors for certain parameters, and also allow you to define the names for some elements, such as clients and hidden networks.
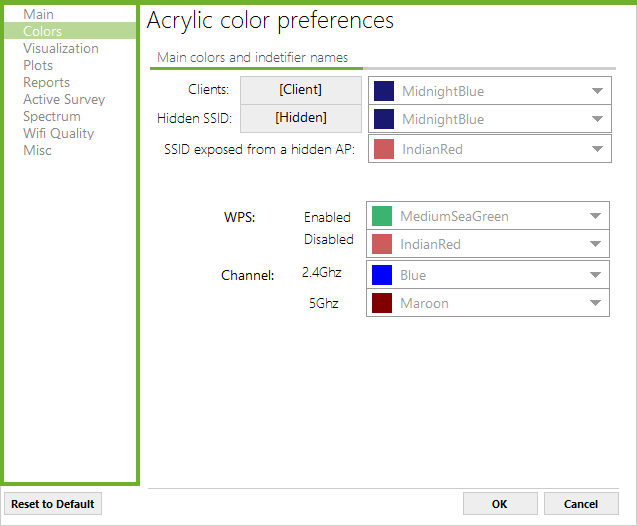
– Clients: This refers to the client devices associated with the access points. Both the descriptive text and the color to be displayed can be configured.
NOTE: Client devices can only be detected when the scan is performed on Monitor Mode, by using either a NDIS supported device or an Airpcap card.
– Hidden SSID: An access point can hide the name of the network it is broadcasting. In this case, the software assigns the predefined text and color to that access point.
– SSID exposed from a hidden AP: Through traffic inspection, Acrylic Wi-Fi Heatmaps can infer, in some cases, the name of a hidden network. In such a case, the name of the network is shown instead of “Hidden SSID” in the predefined color.
– WPS: You can define the color for the WPS configuration for an access point.
– Channel: You can define the color for the frequency band the channel is operating on (2.4Ghz or 5Ghz).
7.1.3. Visualization
This Acrylic Wi-Fi Heatmaps configuration section allows you to manage aspects of the user interface.
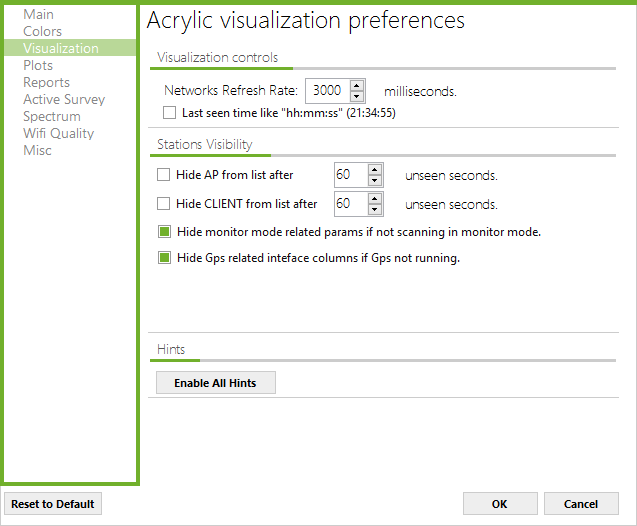
7.1.3.1. Visualization Controls
Refresh Rate: This option allows you to set the refresh rate for the information that Acrylic Wi-Fi Heatmaps receives on network status.

Last seen: This option allows you to define the date format that is applied to the columns indicating the last moment in time that the device was detected.
If not selected, the columns will show the seconds elapsed since the last time the device was seen. If marked, the following time format will be displayed: H:M:S.
7.1.3.2. Station Visibility
This option establishes the time after which the access points and its connected client devices will stop being visualized after Acrylic Wi-Fi Heatmaps stops detecting them.
This functionality is particularly useful to visualize the access points detected during a site survey in real time; otherwise a complete list is always shown in the access point view.
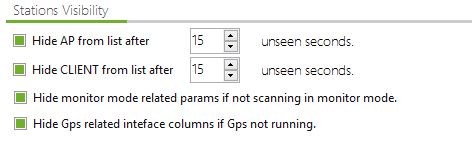
The remaining parameters allow you to hide information only relevant to the Monitor/GPS enabled Mode, in case any of the other options is not enabled.
7.1.3.3. Hints
This option enables context hits that are shown in different sections of Acrylic Wi-Fi Heatmaps.

7.1.4. Plots
This Acrylic Wi-Fi Heatmaps configuration section shows the general options related to the generation of heatmaps and plots resulting from a site survey.
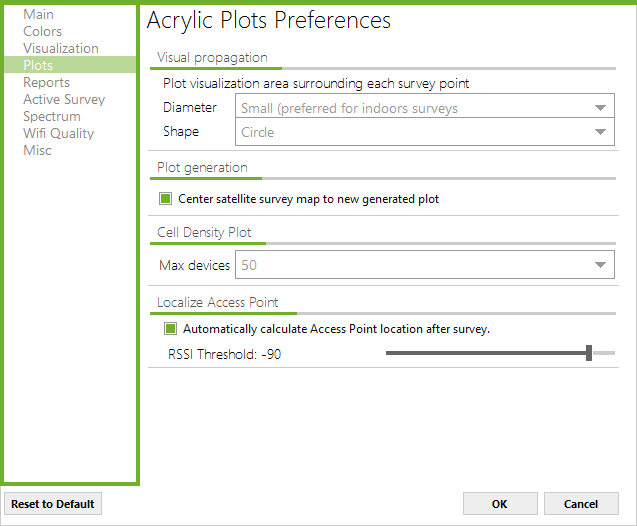
7.1.4.1. Visual Propagation
Diameter: This parameter defines the surveying area for each point in a site survey. This is a confidence parameter: it is considered that beyond the selected diameter, no accurate estimations can be made regarding the parameters to study, such as RSSI, SNR, etc. This parameter limits the area to consider based on the performed measurements, depending if they have been performed in indoor, outdoor, or extensive areas.
It is recommended to configure this parameter according to the type of site survey to performed, since indoor locations usually require more measurements, mostly closer to each other, for more accurate results, because, between construction elements, the Wi-Fi signals do not behave the same way: they signal bounces, gets attenuated, etc.
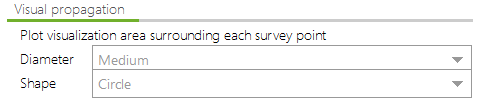
For outdoor areas, where the Wi-Fi signal propagation is better due to the absence of obstacles, the scans do not require a large number of measurements. in order for the plots to accurately cover the site survey area, it is required to enlarge the diameter of validity for each measurement.
This parameter does not affect the way the plots are generated; it only visually affects the dimensions of the area covered by the site survey.
Shape: It is the chosen shape that limits the surveyed area for each point, that can be a circumference, a rectangle, or a hexagon. This is a merely visual parameter, and it does not impact plot generation.
NOTE: For a better map generation performance, the rectangle shape is recommended.
7.1.4.2. Plot Generation
When generating a new plot, the satellite view is centered for a correct visualization of the generated plot.

7.1.4.3. Cell Density Plot
This option specifies the maximum value of devices that will be represented in a device density plot. Available for the plot options.
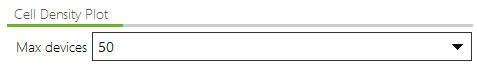
7.1.4.4. Locate Access Point
Acrylic Wi-Fi Heatmaps can estimate the location of an access point once the site survey is completed.
In this section, you can enable or disable access point automatic location after the site survey is completed.
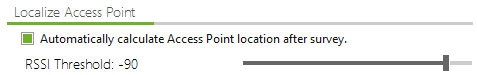
Additionally, this section allows you to define the minimum RSSI used for the automatic location feature. In other words, while the site survey is performed in a certain location, only those access points with a RSSI equal or higher than the value determined by this property are automatically located and assigned to the surveyed location.
7.1.5. Reports
During the report generation process, plots common to all types of reports are generated.
Enabling plot cache implies that, once the plot is generated, this is saved to be later used when required during the report generation process. This reduces the time it takes to generate the reports, since some of the plots do not need to be generated once more. On the other hand, this option function requires more RAM during the report generation process.
The time saved greatly depends on the sections selected for the report and the amount of data to be processed.
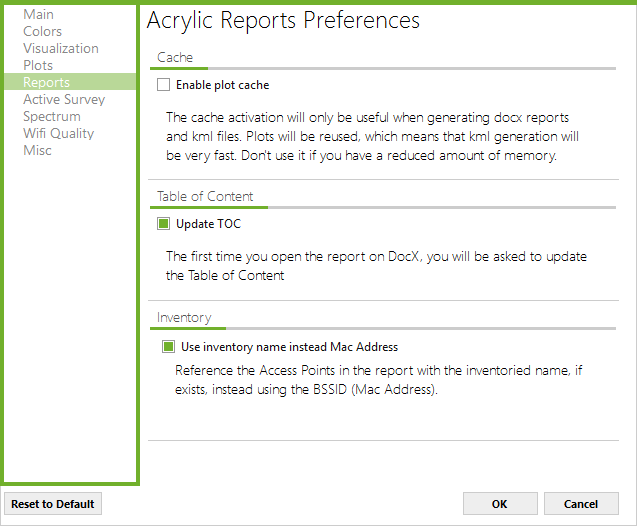
By default, this option is disabled, and should not be enabled if the computer used to generate the reports has little memory available.
7.1.6. Active Survey
This Acrylic Wi-Fi Heatmaps configuration section allows you to configure parameters associated to a site survey.
For detailed information, refer to the Active Survey help section.
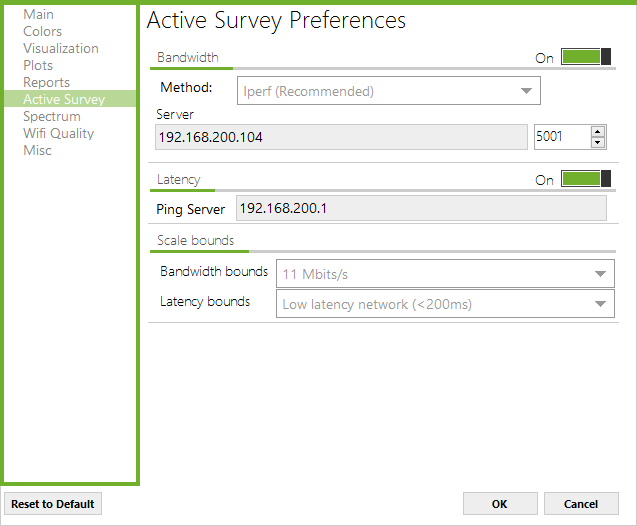
7.1.7. Spectrum
In this configuration section, it is possible to define frequency ranges that will be included in each channel to display the signal obtained with the spectrum analyzer.
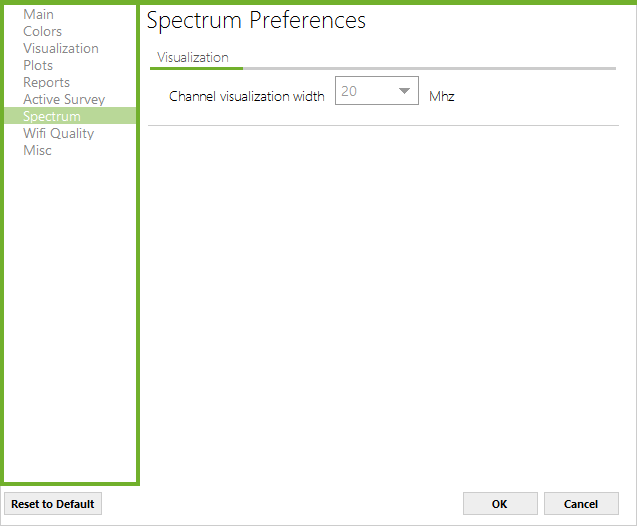
This feature responds to the following need:
When analyzing the data obtained by the spectrum analyzer on a specific channel, it is usually necessary to display the received signal in both, the narrow frequency range of the selected channel and in the adjacent channels, also used by the network.
It is necessary to display the channel width being used by the network (20/40/80/160MHz) in order to have an accurate representation of the signals affecting the network.
7.1.8. Wi-Fi Quality
This Acrylic Wi-Fi Heatmaps configuration section allows you to manage and configure the Wi-Fi network quality control profiles that are available in Wi-Fi Quality the section.
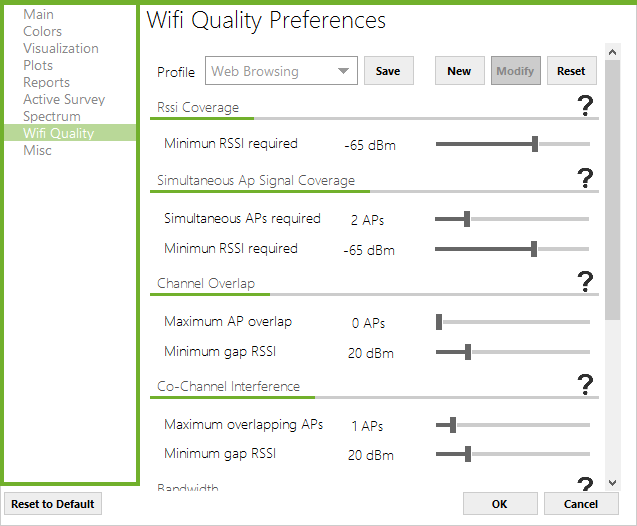
You can create new control profiles, modify existing ones, and remove unnecessary profiles, except for the default profiles.
For more information, please refer to the Wi-Fi Quality section in this manual.
7.1.9. Misc
This Acrylic Wi-Fi Heatmaps configuration section contains allows you to define those additional options that are related to the software behavior under certain situations.
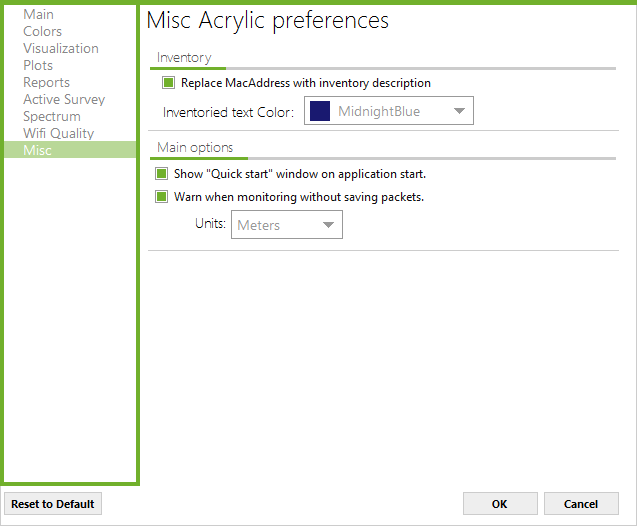
7.1.9.1. Inventory
You can enable or disable the option to
replace the MAC addresses by the names that have been assigned to them in the
inventory.

You can also define the display color for the inventoried items.
7.1.9.2. Main Options
You have the option to hide or show the Quick Star window that appears by default when Acrylic Wi-Fi Heatmaps is started. Additionally, is after performing a measurement that fails to any capture data packets, a warning window appears to indicate that the measurement is void.
You can also establish the default length unit used by Acrylic Wi-Fi Heatmaps (meters or feet).
7.2. GPS
Acrylic Wi-Fi Heatmaps uses GPS devices to perform geopositioning measurements with latitude, longitude, and altitude coordinates.
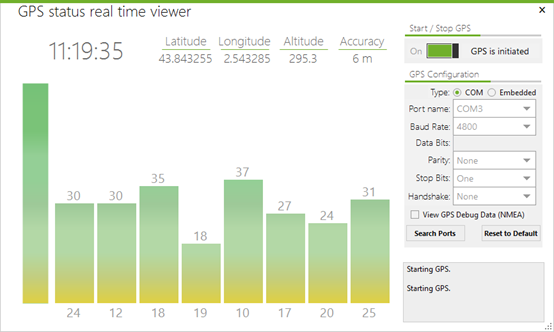
To make a correct use of a GPS device, the COM port parameters should be precise. If you are unsure, or the GPS device displays no data, refer to the GPS device manufacturer’s user guide to verify the entered parameters are correct.
GPS technology uses satellite data, and this data is used to triangulate the position. The GPS window displays the number of feeding satellites, as well as
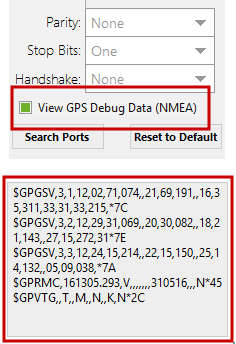
their signal strength. Under optimal conditions, and if valid coordinates are being correctly fed to the GPS device, these coordinates, along with their accuracy, are displayed at the top of the window.
To verify if the data is being received, you can check the Debug Data box.
NOTE: In indoor areas, GPS devices are less accurately. NMEA data can be displayed if the debug box is selected, but this data will not contain valid coordinates.
For more information on supported devices, please refer to the section on GPS devices.
7.3. Inventory
This window shows all the devices that had been inventoried.
When a device is inventoried, a friendly name is assigned to its MAC Address, so each time you use Acrylic Wi-Fi Heatmaps, this device will be identified with the assigned name instead of the MAC Address.
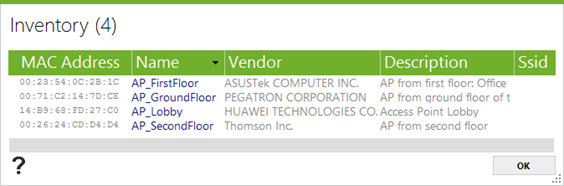
The columns in this section are described below:
|
Column |
Information Provided |
|
Mac Address |
(Media Access Control Address) Unique identifier assigned to network interfaces that is used as a network address. |
|
Name |
Friendly name given to a device. This name will be displayed in Acrylic Wi-Fi Heatmaps instead of the MAC Address. |
|
Vendor |
Name of the device manufacturer. Non-editable: It is automatically obtained from the MAC address. |
|
Description |
Description of the access point. |
|
SSID |
Network name. |
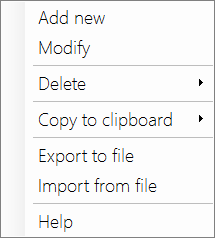
When right clicking on each inventory item, a contextual scroll-down menu for that item appears.
The available options are shown below:
|
Menu Item |
Function |
|
Add new |
Adds a new entry in the inventory |
|
Modify |
Allows to modify the information of an inventoried |
|
Delete |
Removes an inventoried element |
|
Copy to Clipboard |
Allows copying inventoried elements information on the |
|
Export to File |
Allows exporting inventory |
|
Import to File |
Allows to import inventory content from a .csv file |
8. Copyright
Copyright
Acrylic Wi-Fi and Tarlogic are trade names and service names by Tarlogic Security S.L., including its respective logos, are registered in the European Patent Office (OEP), and may be registered in other countries’ patent and trade name offices.
All other trade names are exclusive property of their respective owners.